Why use Google Analytics?
As a business owner, you are always thinking to improve your revenue, operations and consumer engagement. Google Analytics, now in its fourth iteration (GA4), is a user-friendly but advanced tool which collects real-time data and provides you with a wide range of useful insights that can be applied towards your marketing efforts. GA4 is also very effective in the long term, as it can help entrepreneurs predict client behavior and create innovative ideas to continuously re-invent as a company.
Google Analytics (GA): Which version are you using?
It was announced that on 1st July 2023, the previous generation of GA, Universal Analytics (UA), will stop all processes and be completely replaced by its most recent successor, Google Analytics 4 (GA4). Thus, users who are still relying on UA for data processing are strongly recommended to make the switch to GA4 in order to prevent any potential loss of information, as well as to begin collecting data in GA4 as soon as possible.
First, let’s check which version you are using right now:
- If you created your account after October 14 2020, you are already using GA4 and no switching actions are required.
- If you created your account before October 14 2020, and have not yet created a new GA4 property, you are still using UA.
In the case that your business is still using UA, here are the steps you can take to prepare for switching to GA4 going forward.
More information to help with your UA to GA4 conversion can be found here!
How can GA4 assist and support business owners?
The following are some of the metrics GA4 can deliver regarding your website’s performance:
- The number of visitors your pages gets
- Frequency of visits
- Channels through which visitors access your pages
- How long visitors stay on your pages
- Performance of your Google Ads
- Visitor conversion rates – percentage of visitors who stay and complete desirable actions on your website, such as filling out a form or buying a product
- Visitor bounce rates – percentage of sessions in which visitors leave the website after only viewing a single page
Having access to the above data is core to improving your business operations
What actionable insights we can automatically obtain with the data above?
- Provides quantitative measures of your performance in each page of your website
- Gain a deeper understanding of which product/ service visitors come to your pages for
- Identify target groups and construct optimal channels based on the provided data
- Measure your marketing and Google Ads effectiveness & efficiency
Basics of Google Analytics
- Initial Setup
- Link your Data Sources
- Adding Google Analytics Script to your Website (Wix/ WordPress)
- Share Access to Other People
- How to Email Yourself a Recurring Report
a) Initial Setup
The first step to using google analytics is to set up your account and link the data sources.
1) Account Setup
- Head over to https://analytics.google.com/ , and press ‘start measuring’
- Insert your account name and choose data sharing settings options.
- Make sure you read and check which data sharing options you want to enable.

2) Property Setup
- Insert your property name, and set reporting time zone along with the currency of your choice. Google Analytics will provide you with the reports in your chosen time zone and currency.
- Note that you can register multiple properties later on. Make sure you insert the relevant and specific property names! i.e. Stevie Corp Website, Stevie Corp marketing campaigns website, etc.

3) About your Business
You will then be asked to provide relevant information about your organization.
- Industry
- Size of your organization
- What you would like to achieve through Google Analytics (GA4 will still provide you with the same interface and service, but its AI suggestions in the future may vary depending on your choices.)

b) Link your Data Sources
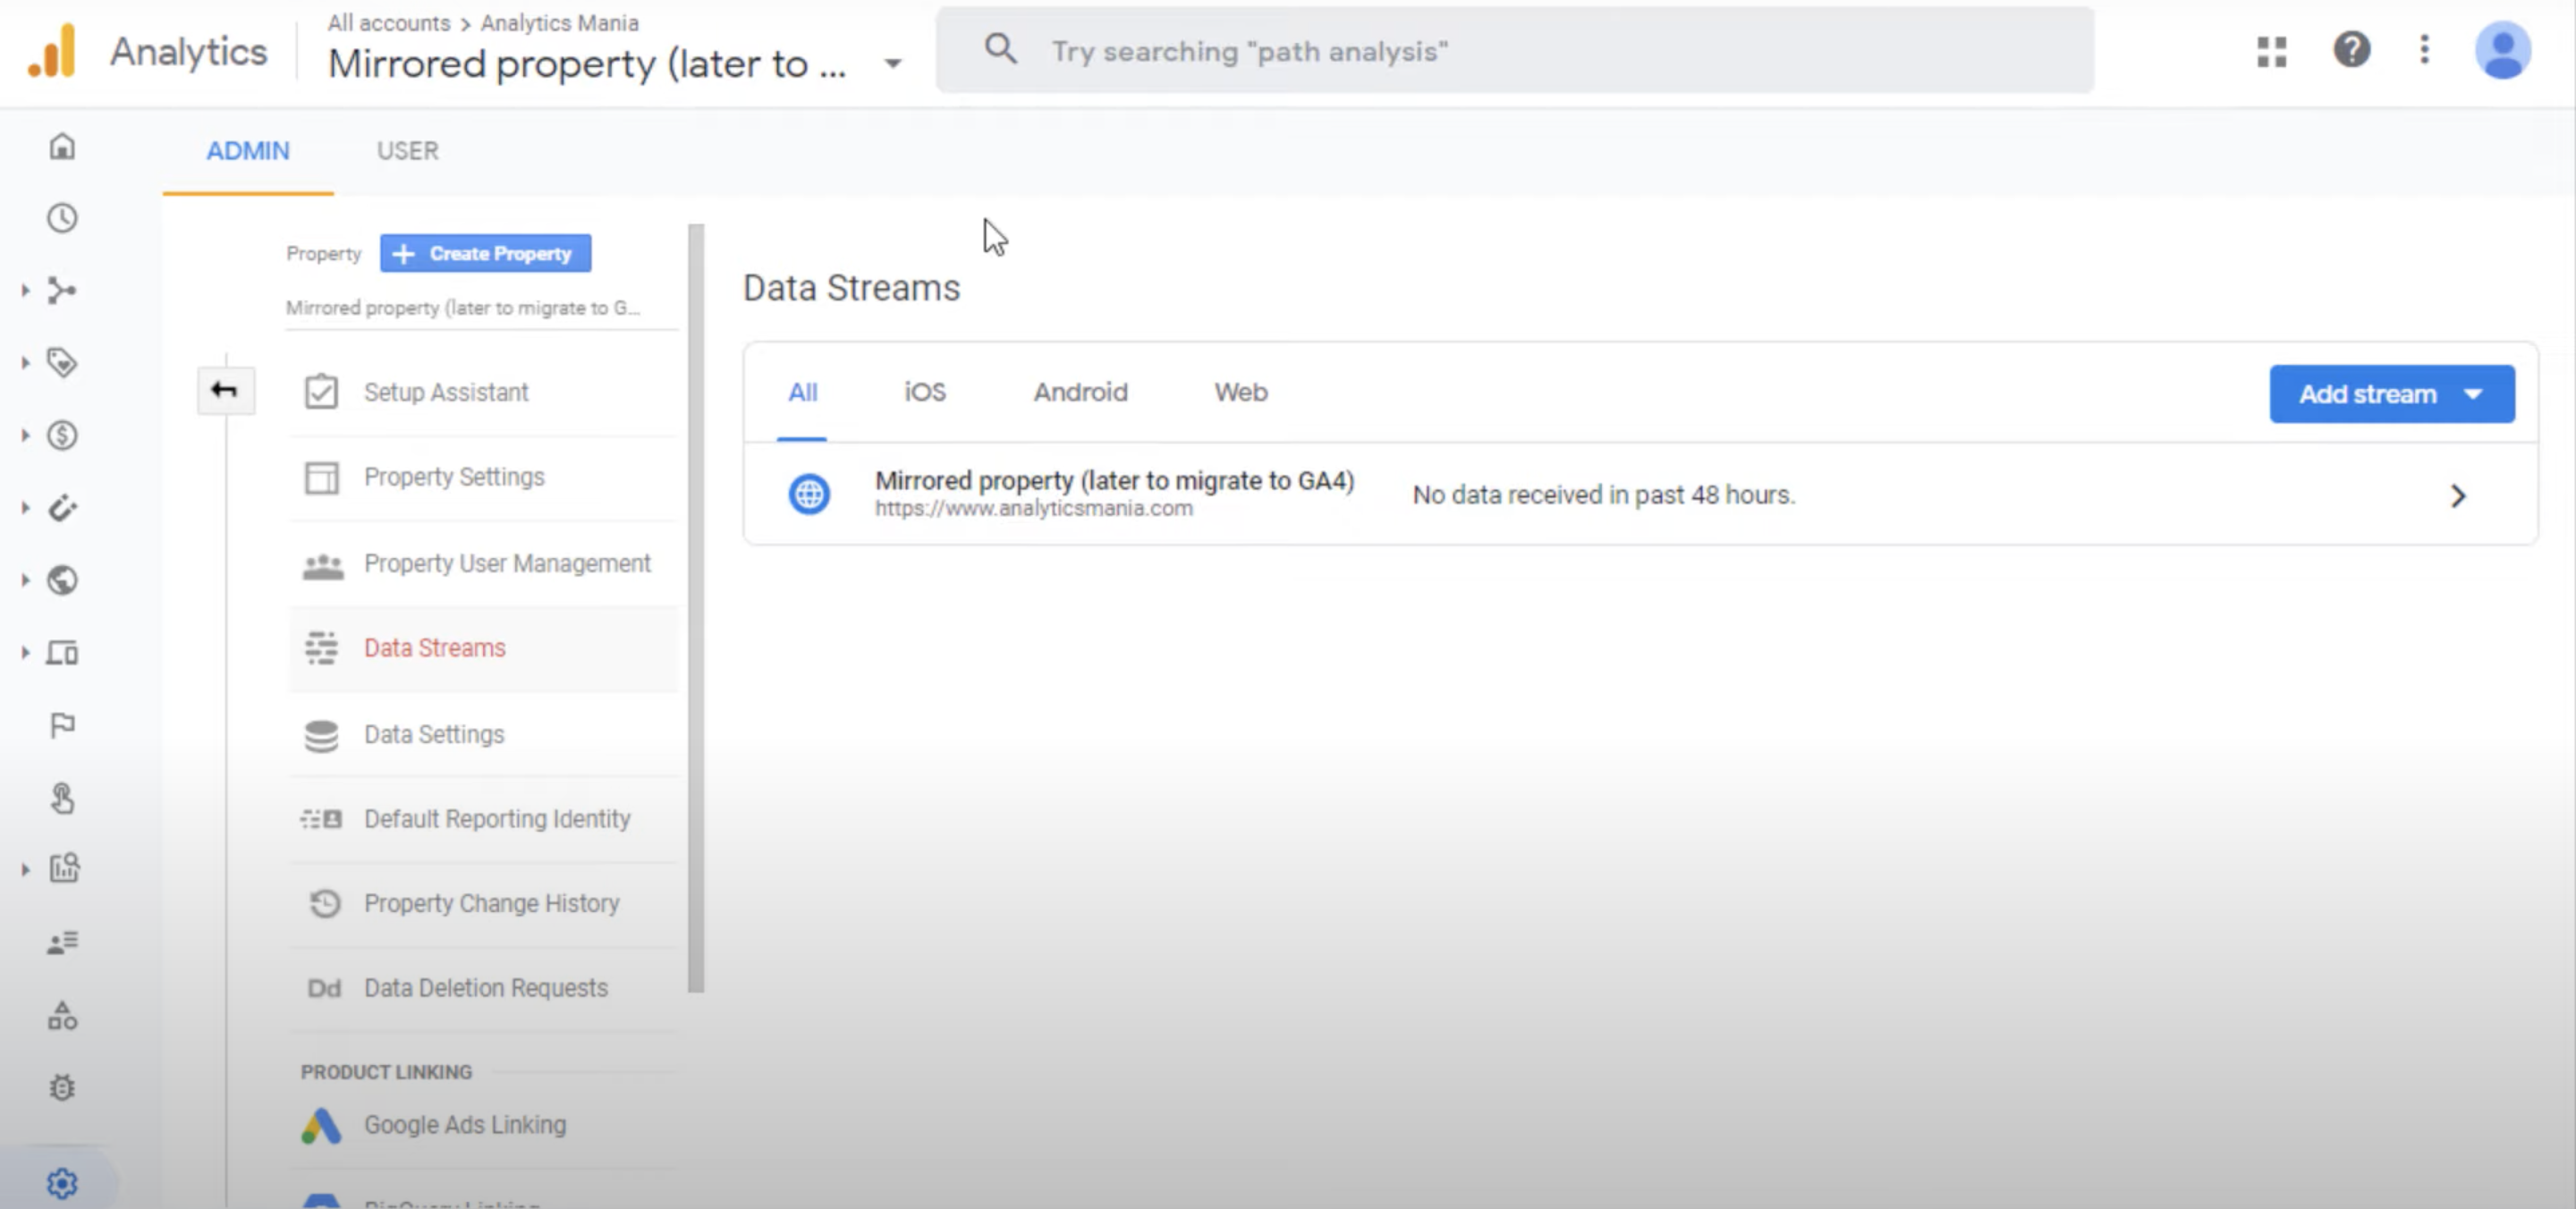
If you have completed setting up your account and properties, you will be able to see the ‘Admin’ page in Google Analytics 4. Now link your data sources in the Admin page by following the below steps:
- In the property tab, click ‘Data Streams’

- Select a platform of data stream source that you would like to track in Google Analytics

- insert your Website URL, and the name of the data stream
- We recommend you allow ‘enhanced measurement’ for Google Analytics 4 to measure various data.

- Link created – your data stream will now appear on the ‘Admin’ page
c) Adding Google Analytics script to your website (Wix/Wordpress)
For Google Analytics to extract and track the data flow regarding in and out of your website, you need to connect your website with the tracking ID or insert the tracking code lines into your HTML file.
Connecting Wix website
- Go to ‘Property User Management’ → ‘Tracking Info’ → ‘Tracking Code’ → Copy the ‘Tracking ID’

- Go on Wix → Select the website you want to connect with GA4
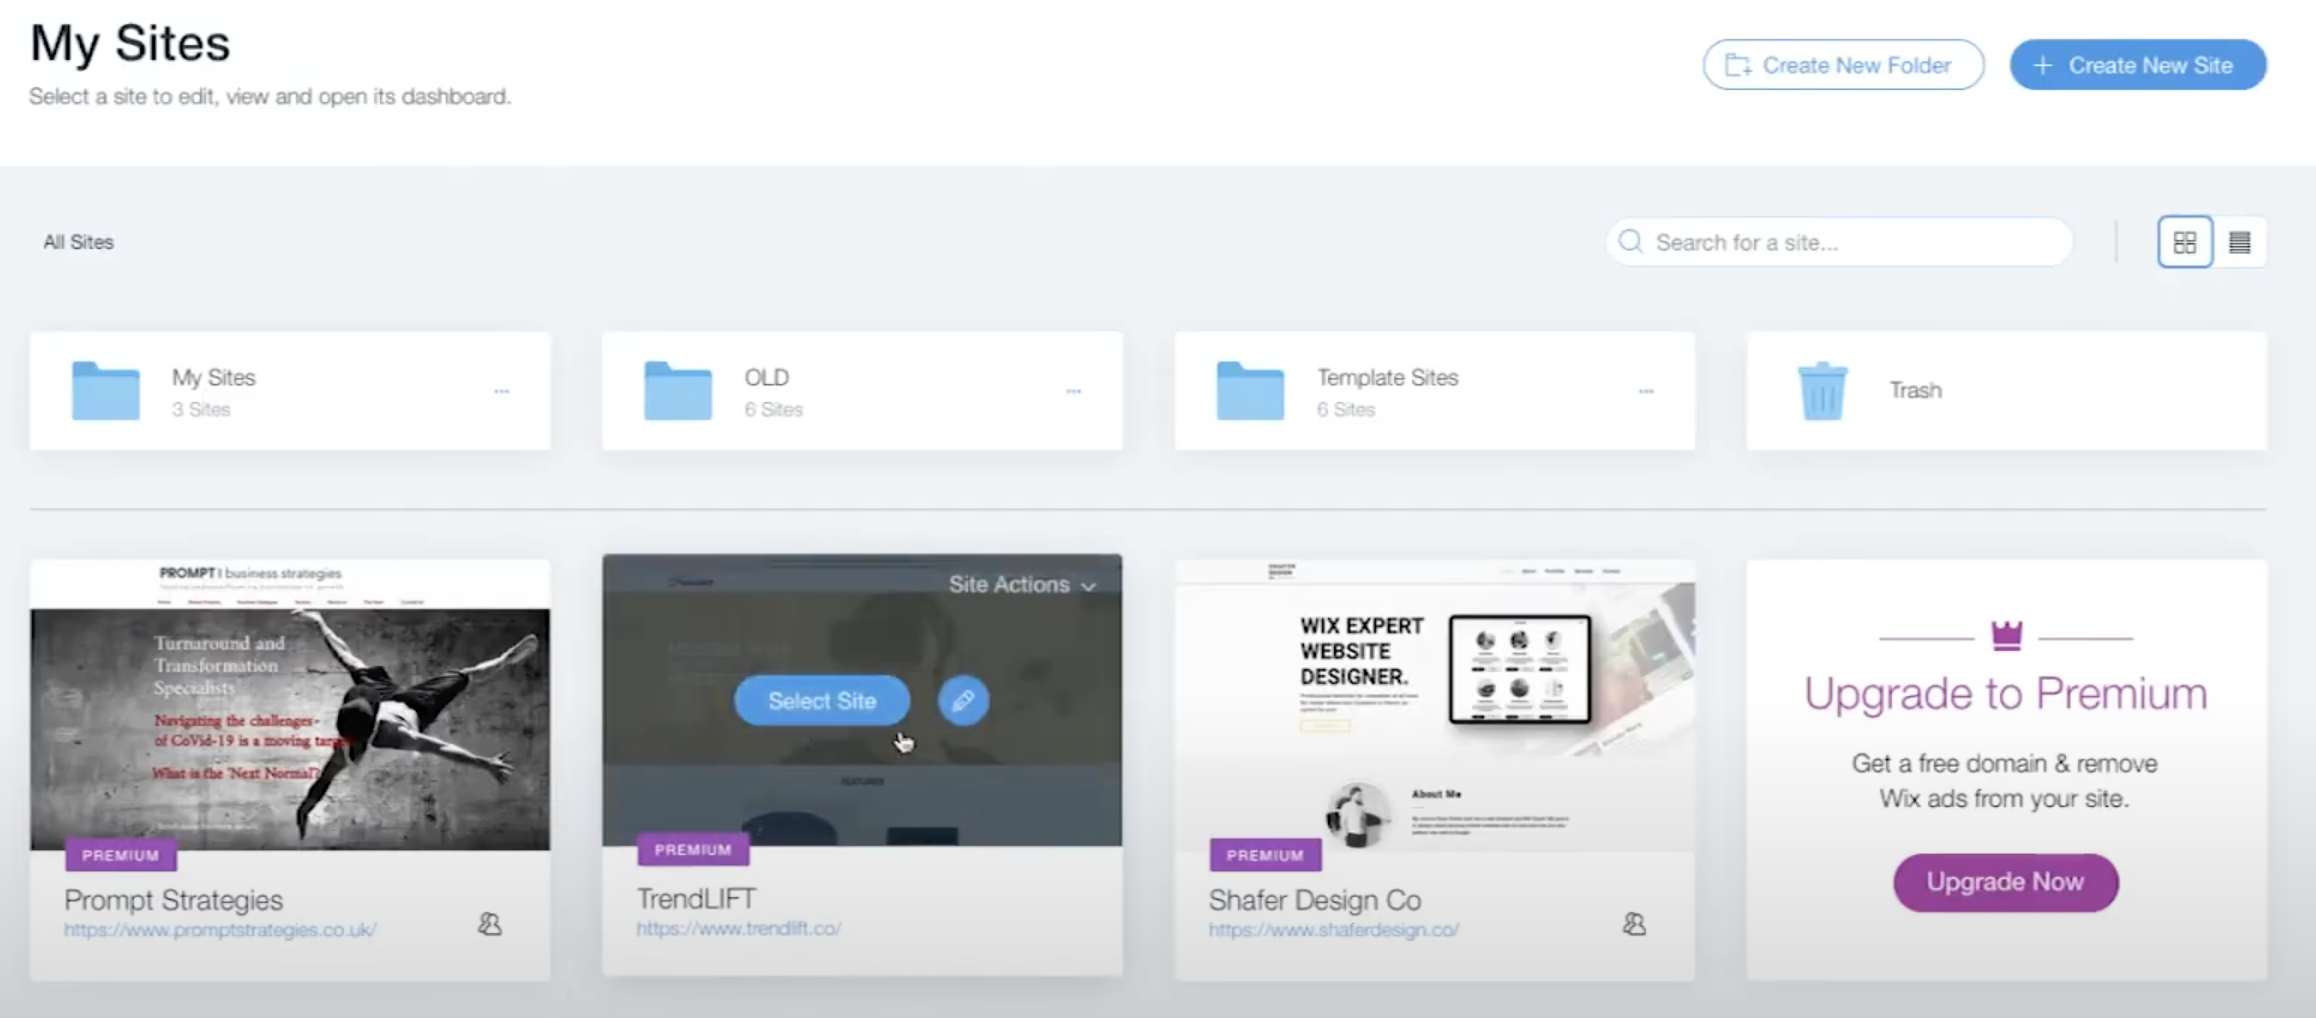
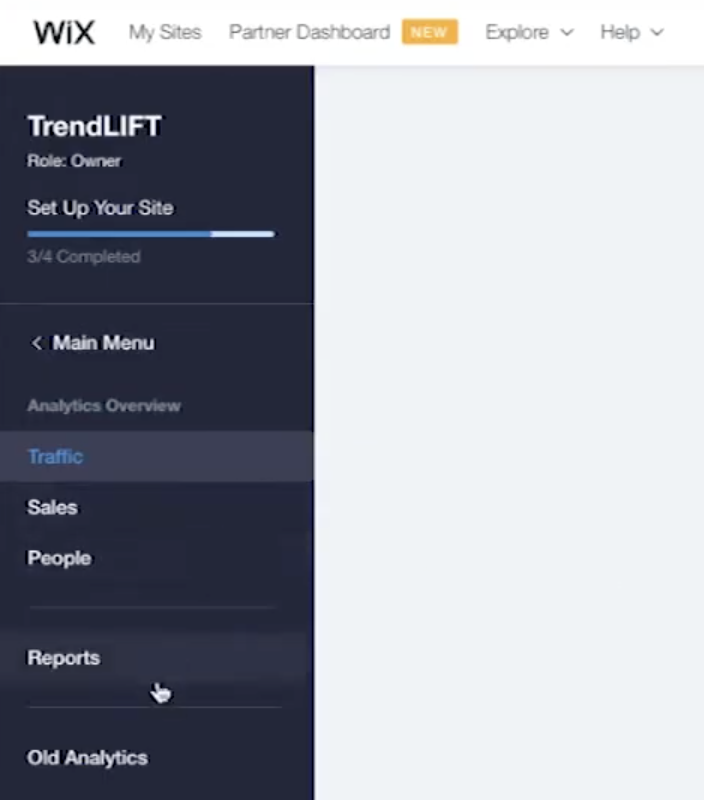
- Click on ‘Analytics & Reports’ → ‘Old Analytics’

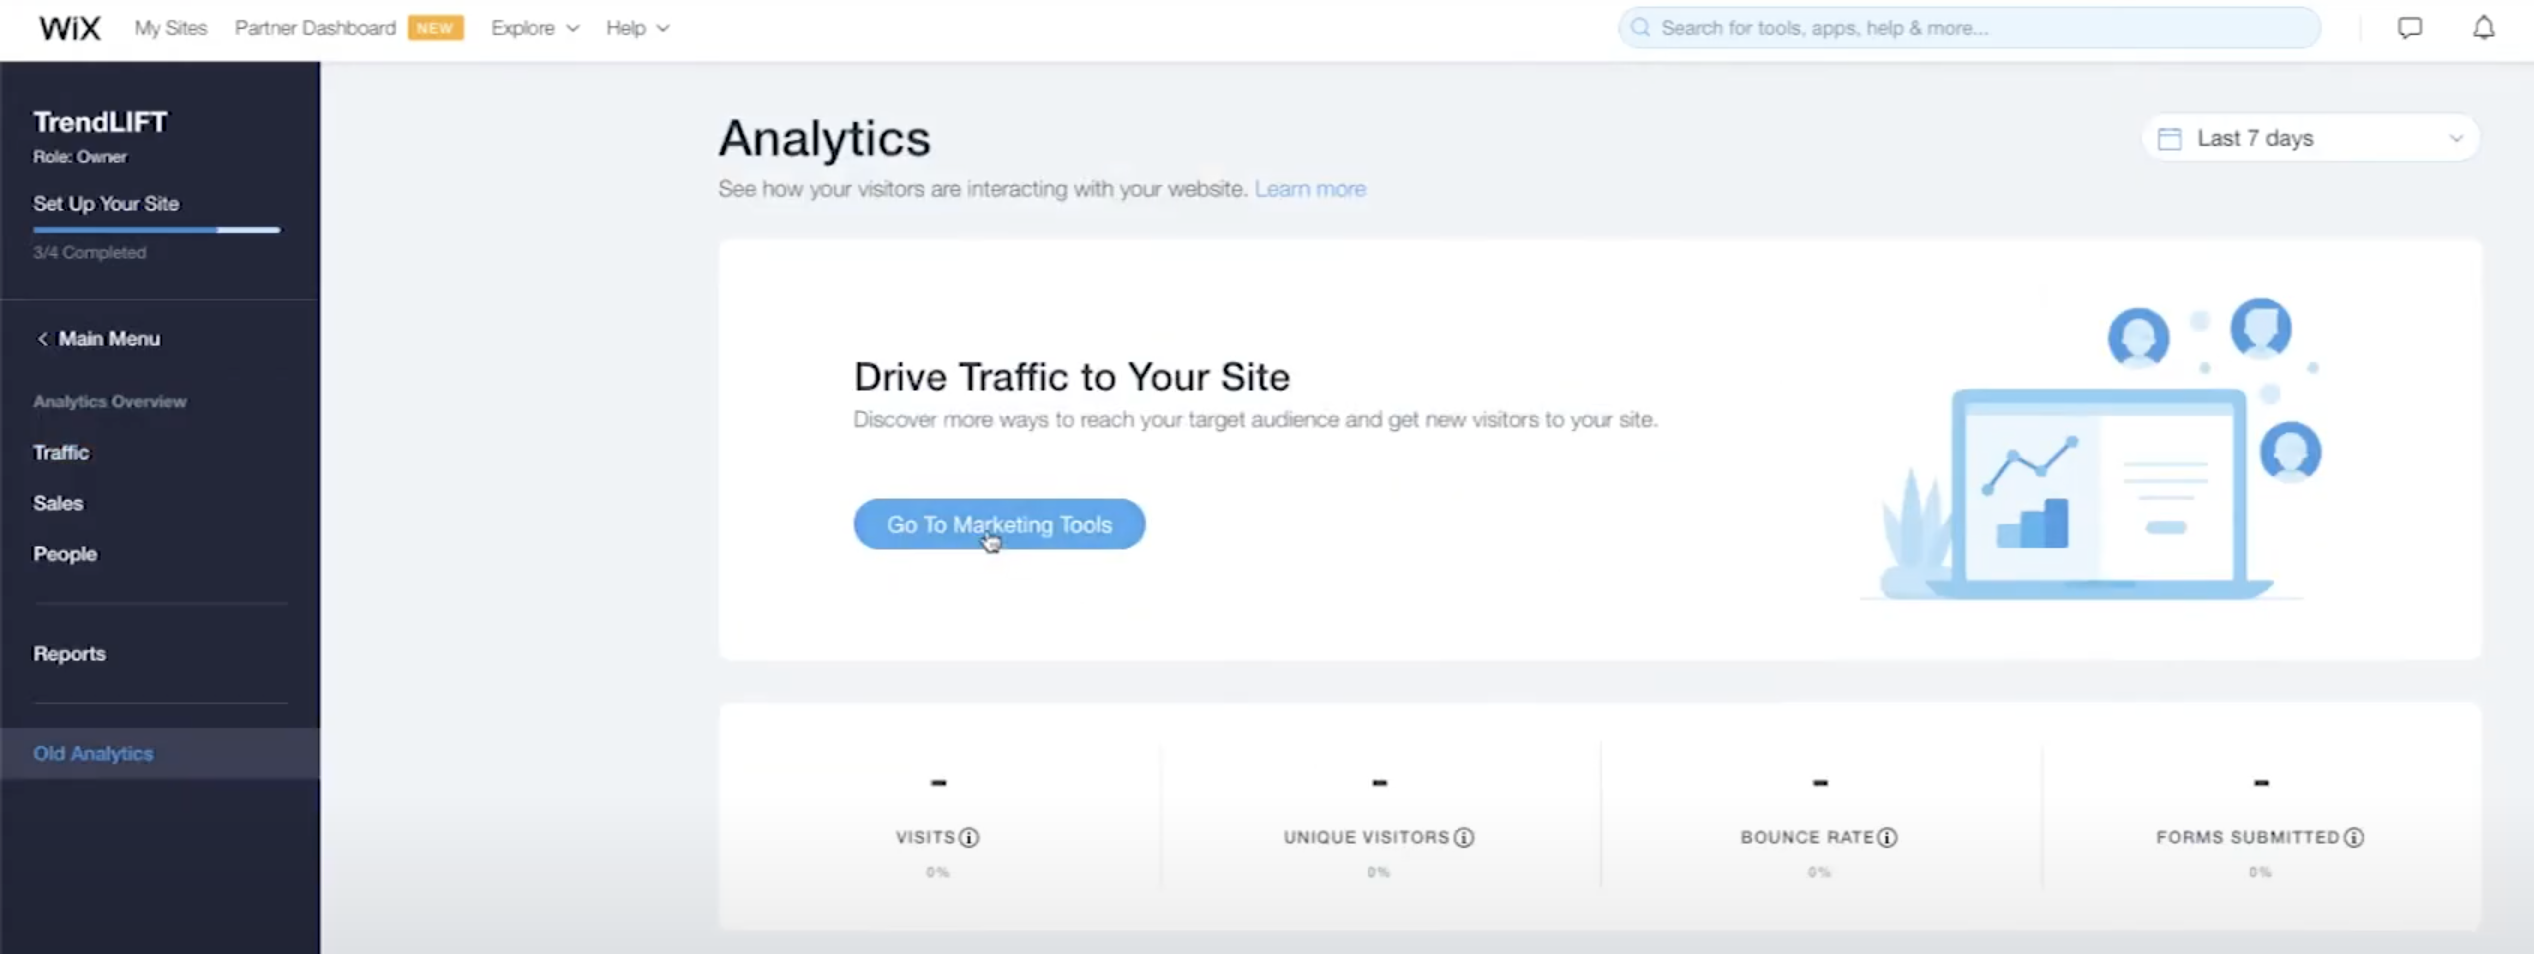
- Press ‘Go to Marketing Tools’
- Scroll down to find ‘Marketing Integrations’
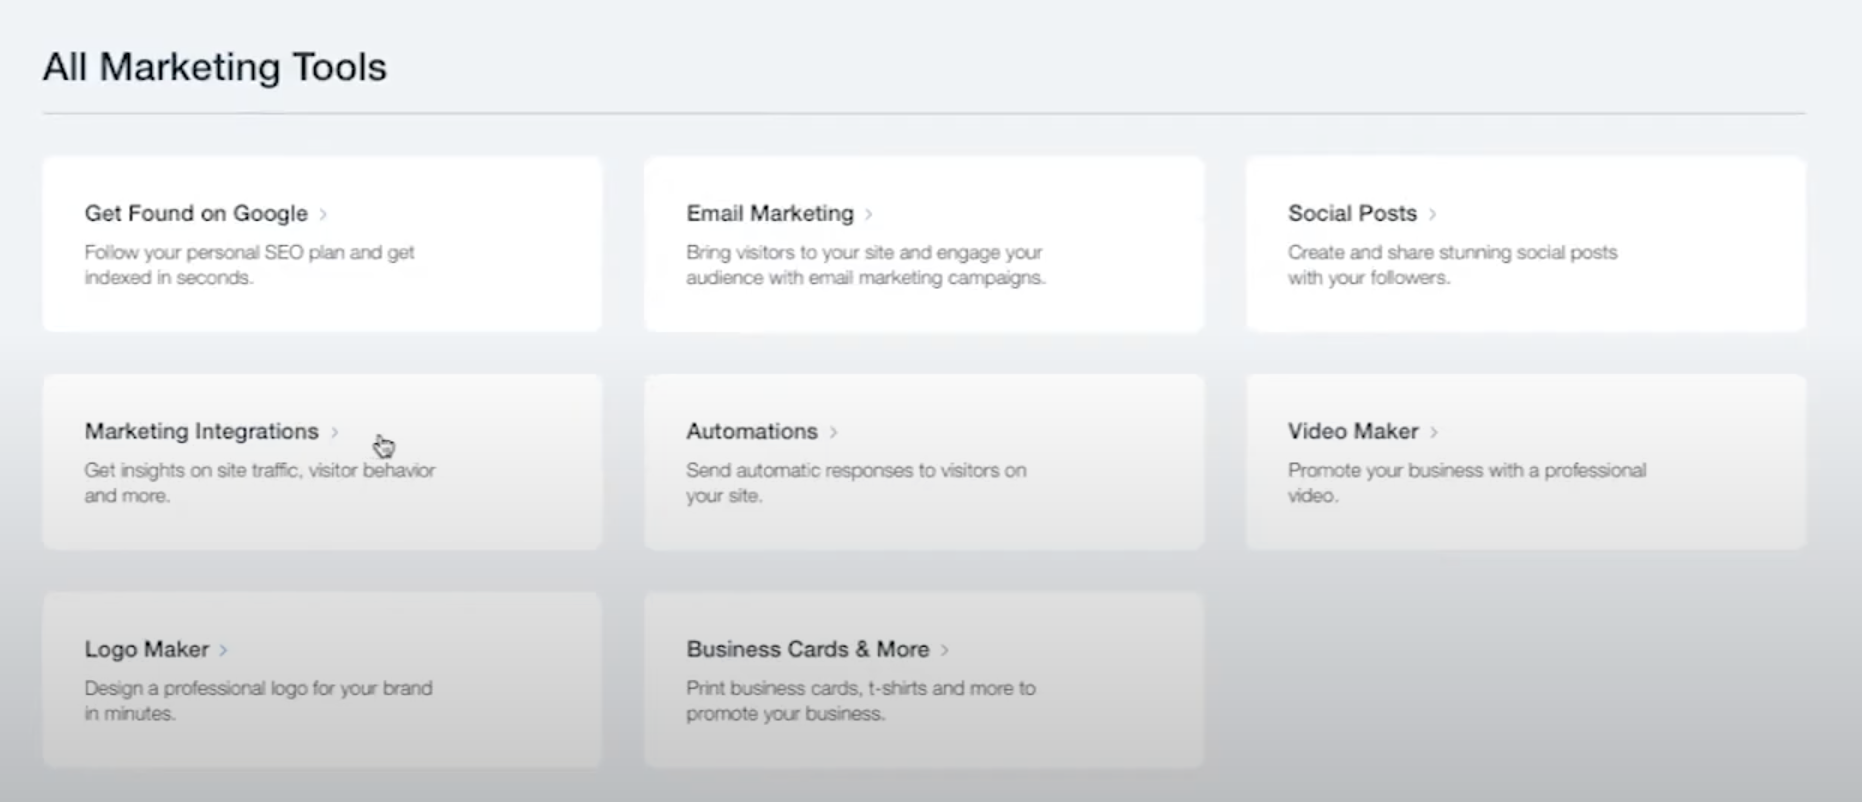
- Find ‘Google Analytics’ → Click on ‘Connect’
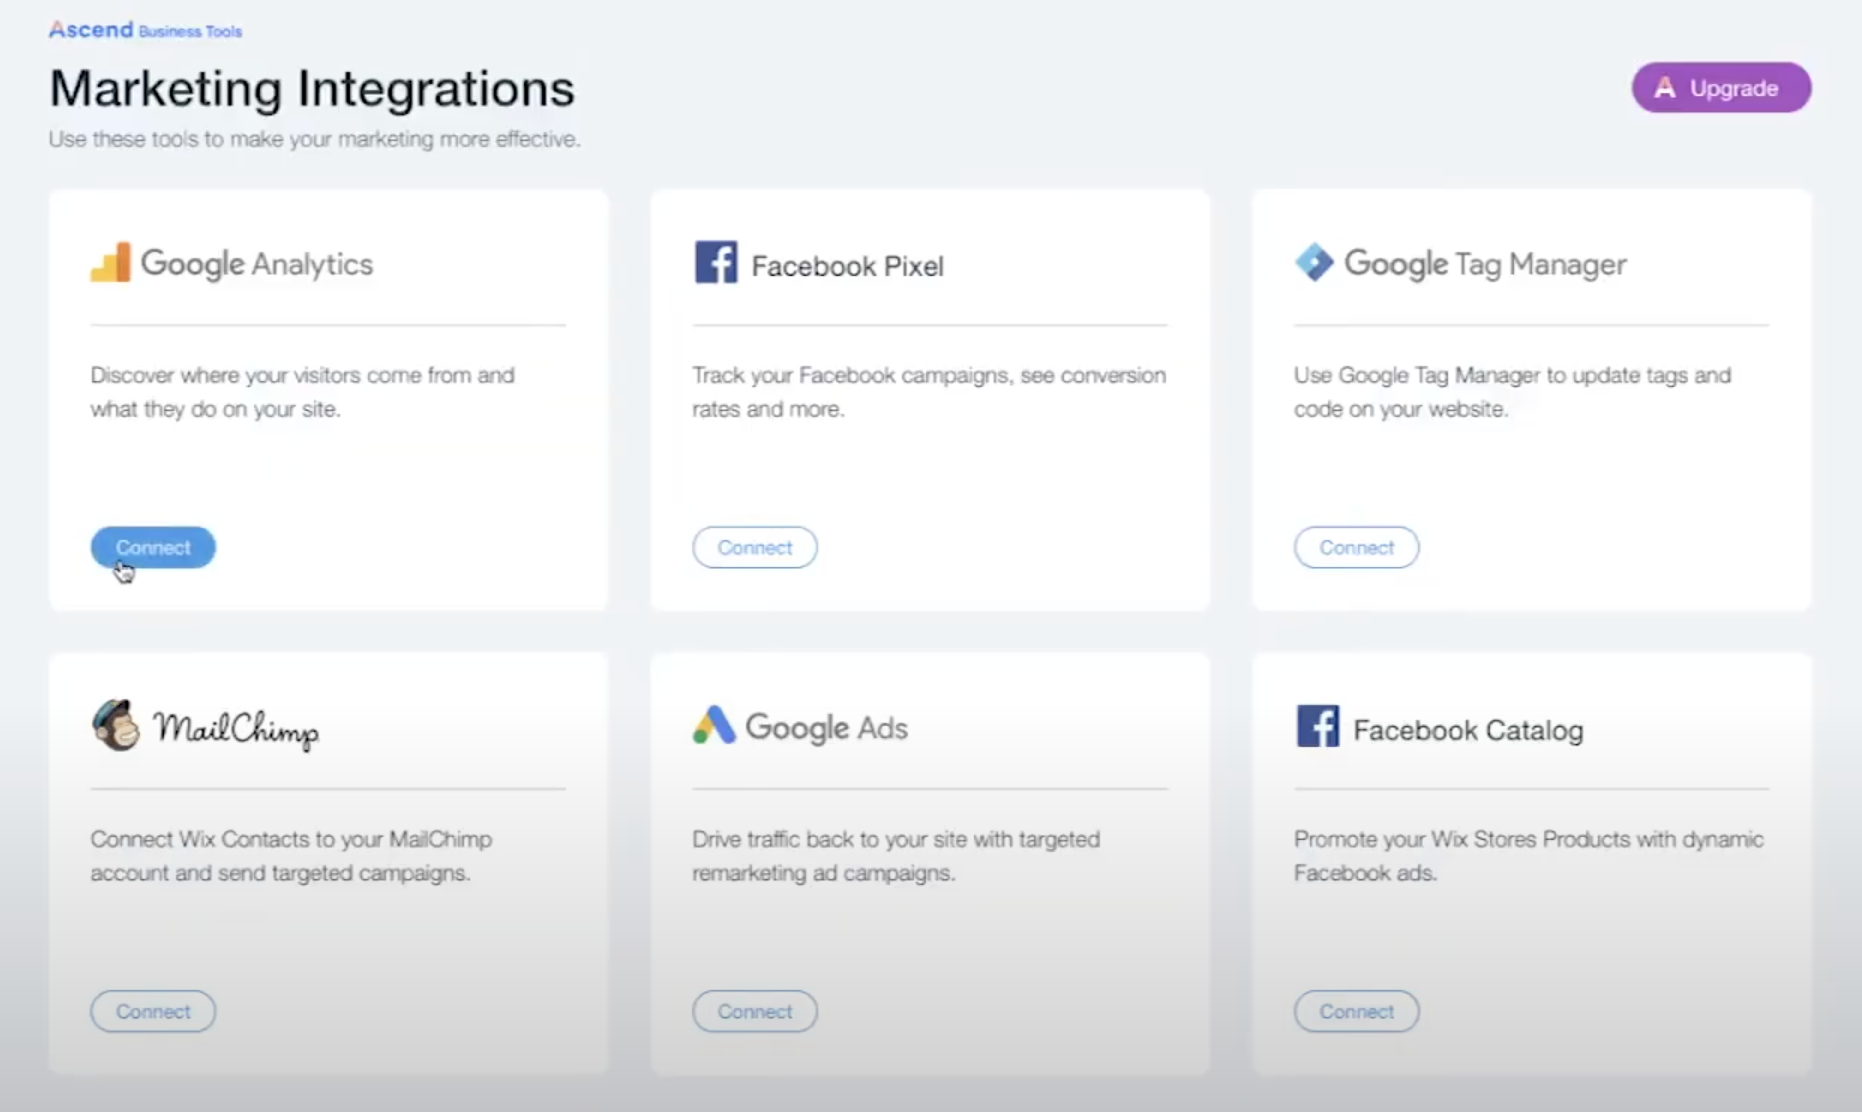
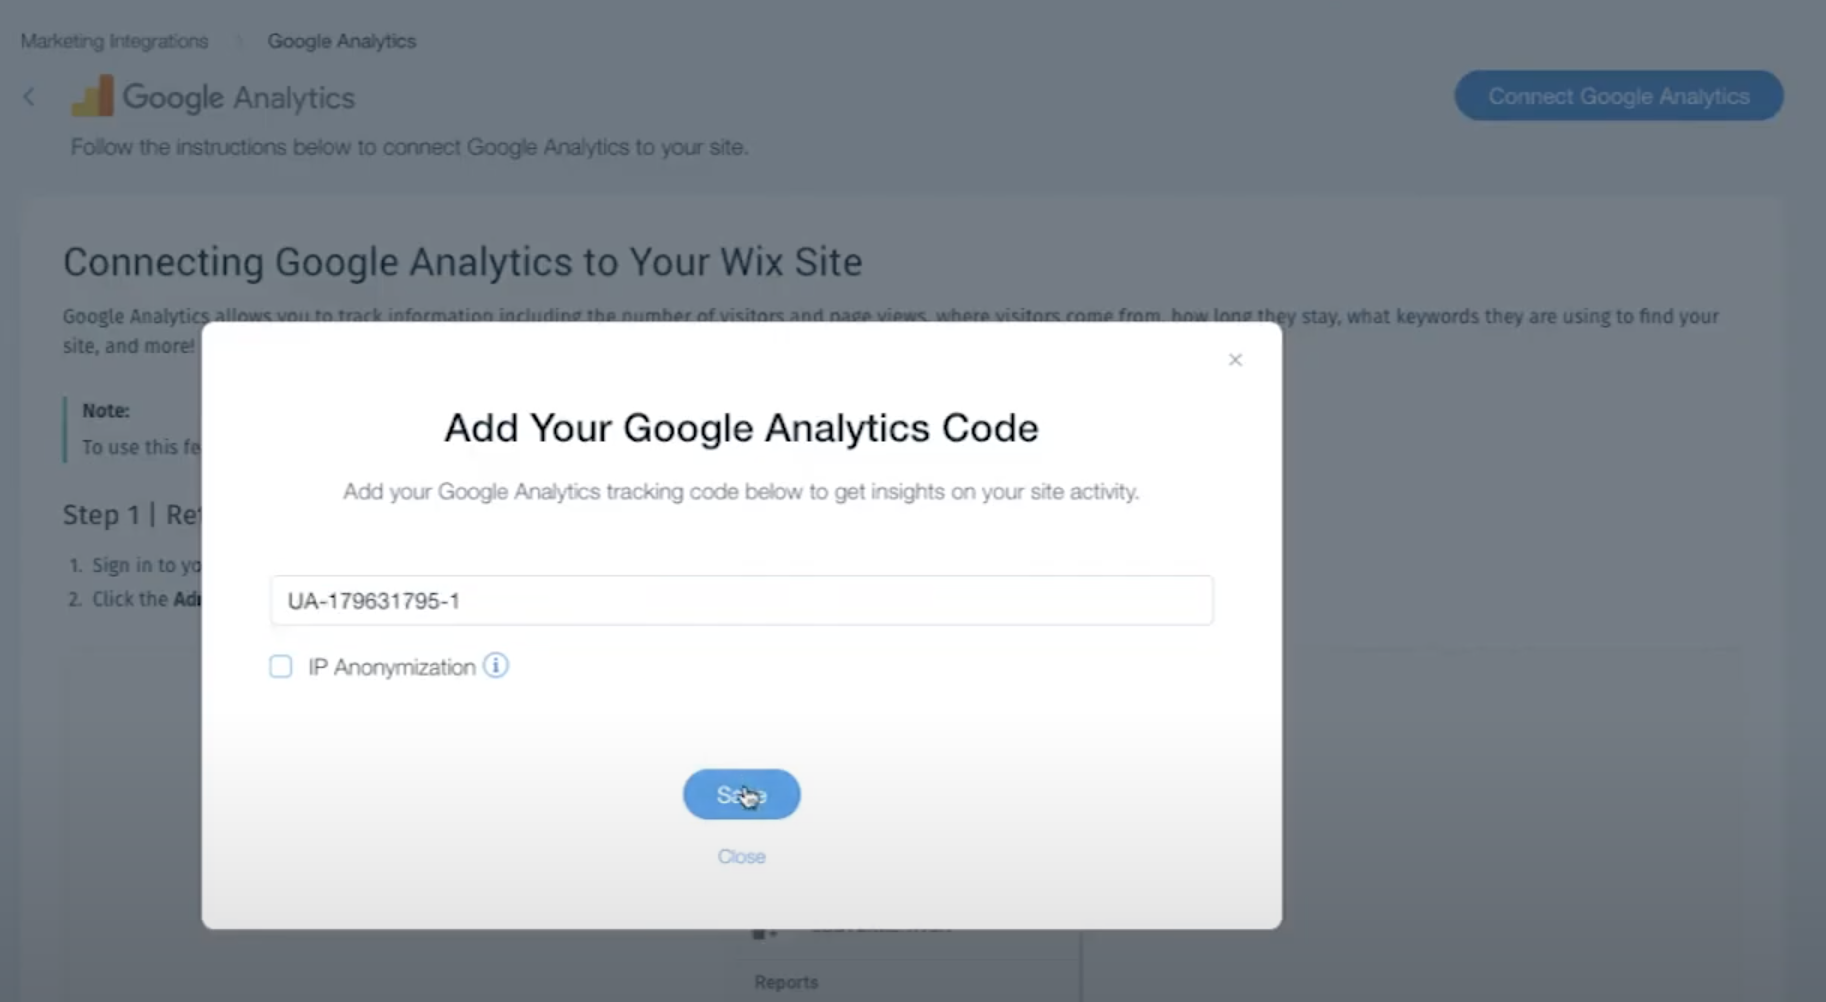
- Click on ‘Connect Google Analytics’ on the top right → Paste your GA4 ‘Tracking ID’ in the pop-up and save.
Connecting WordPress website
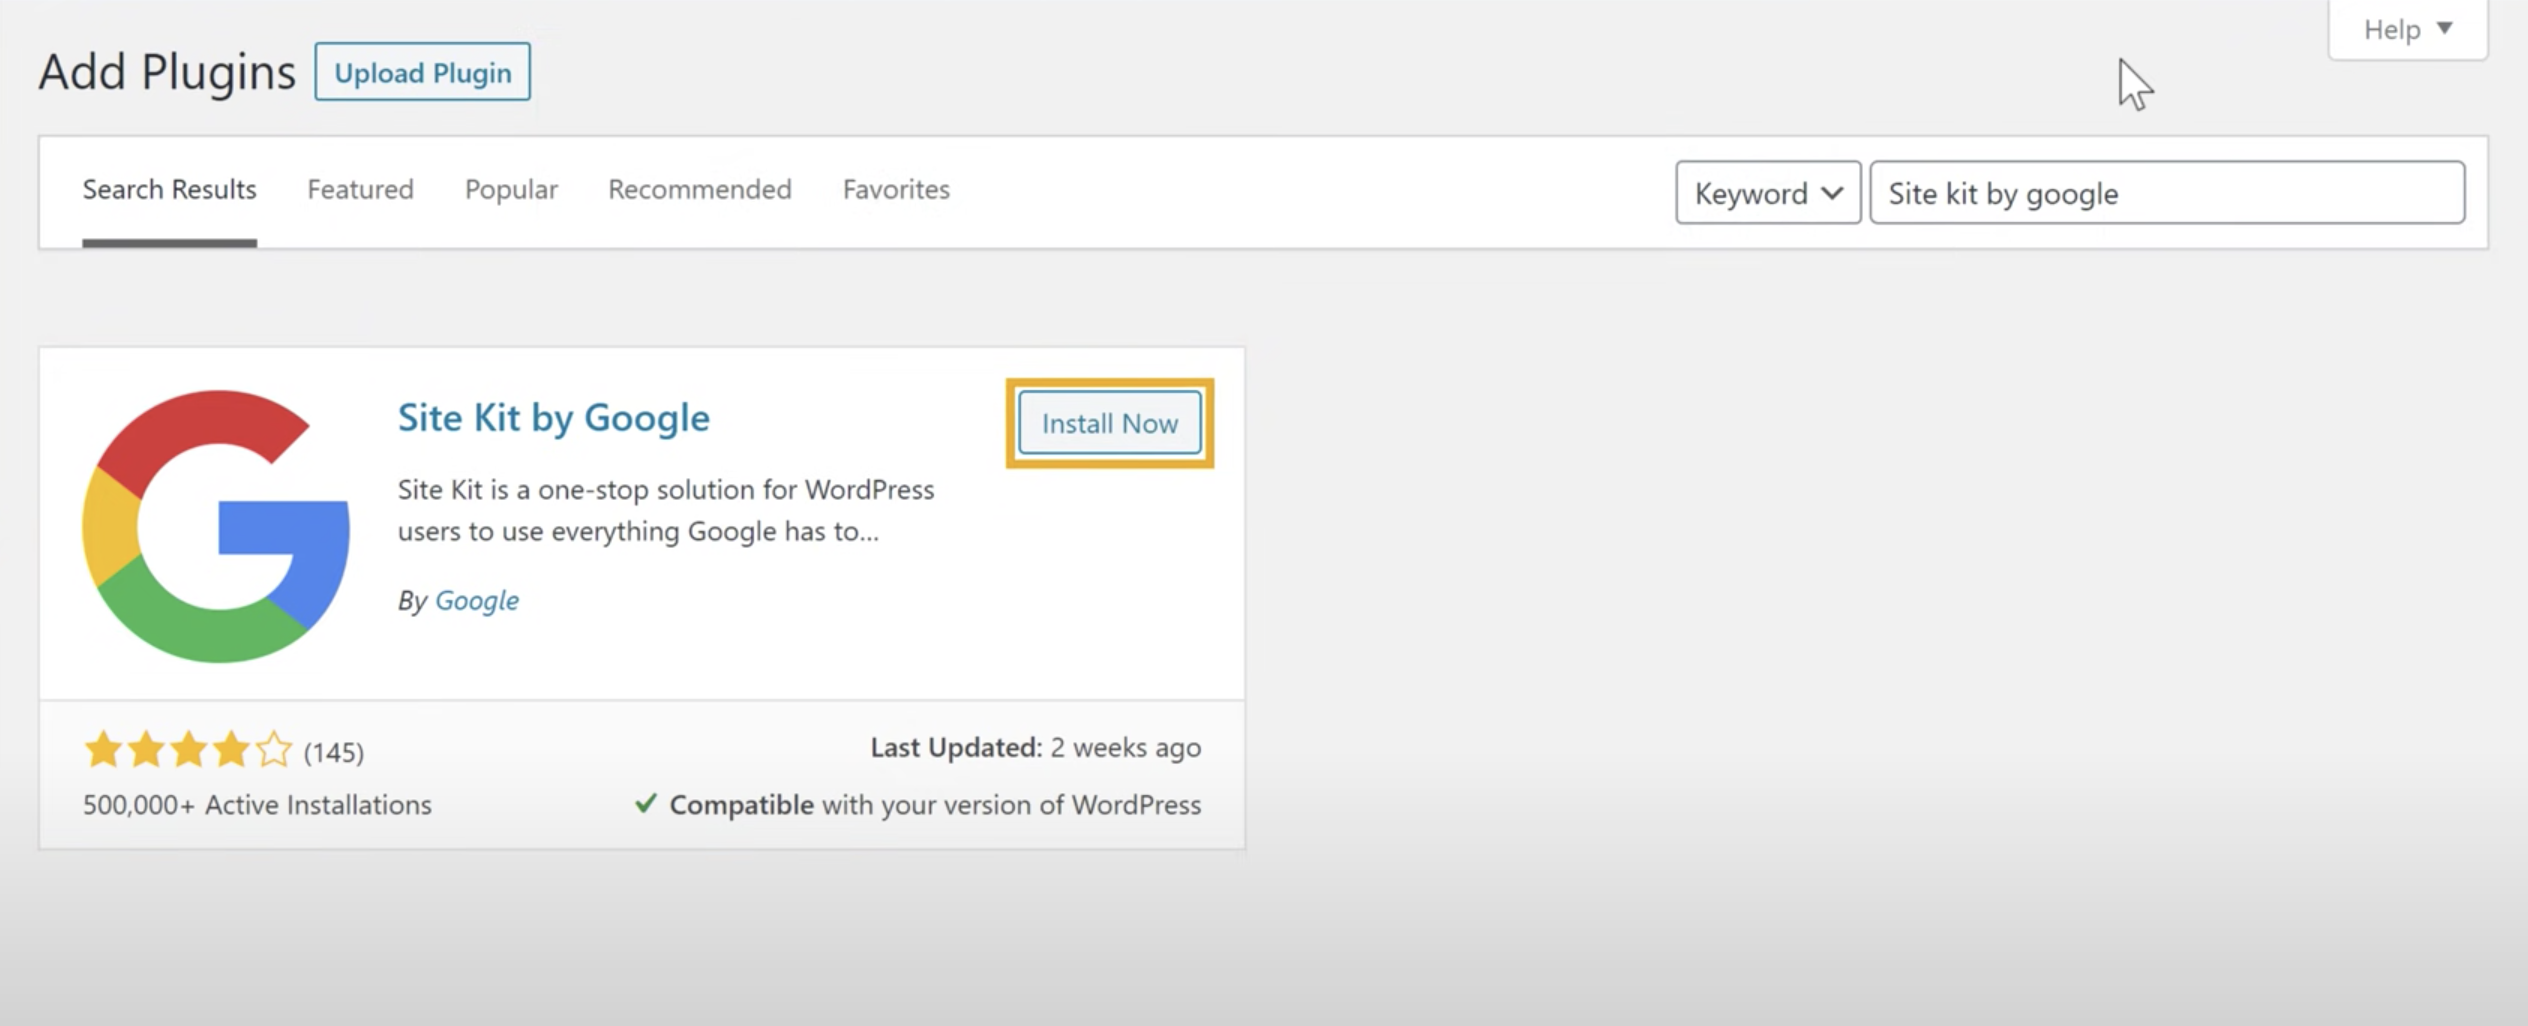
- Your WordPress Admin page → ‘Plugins’ → ‘Add New’
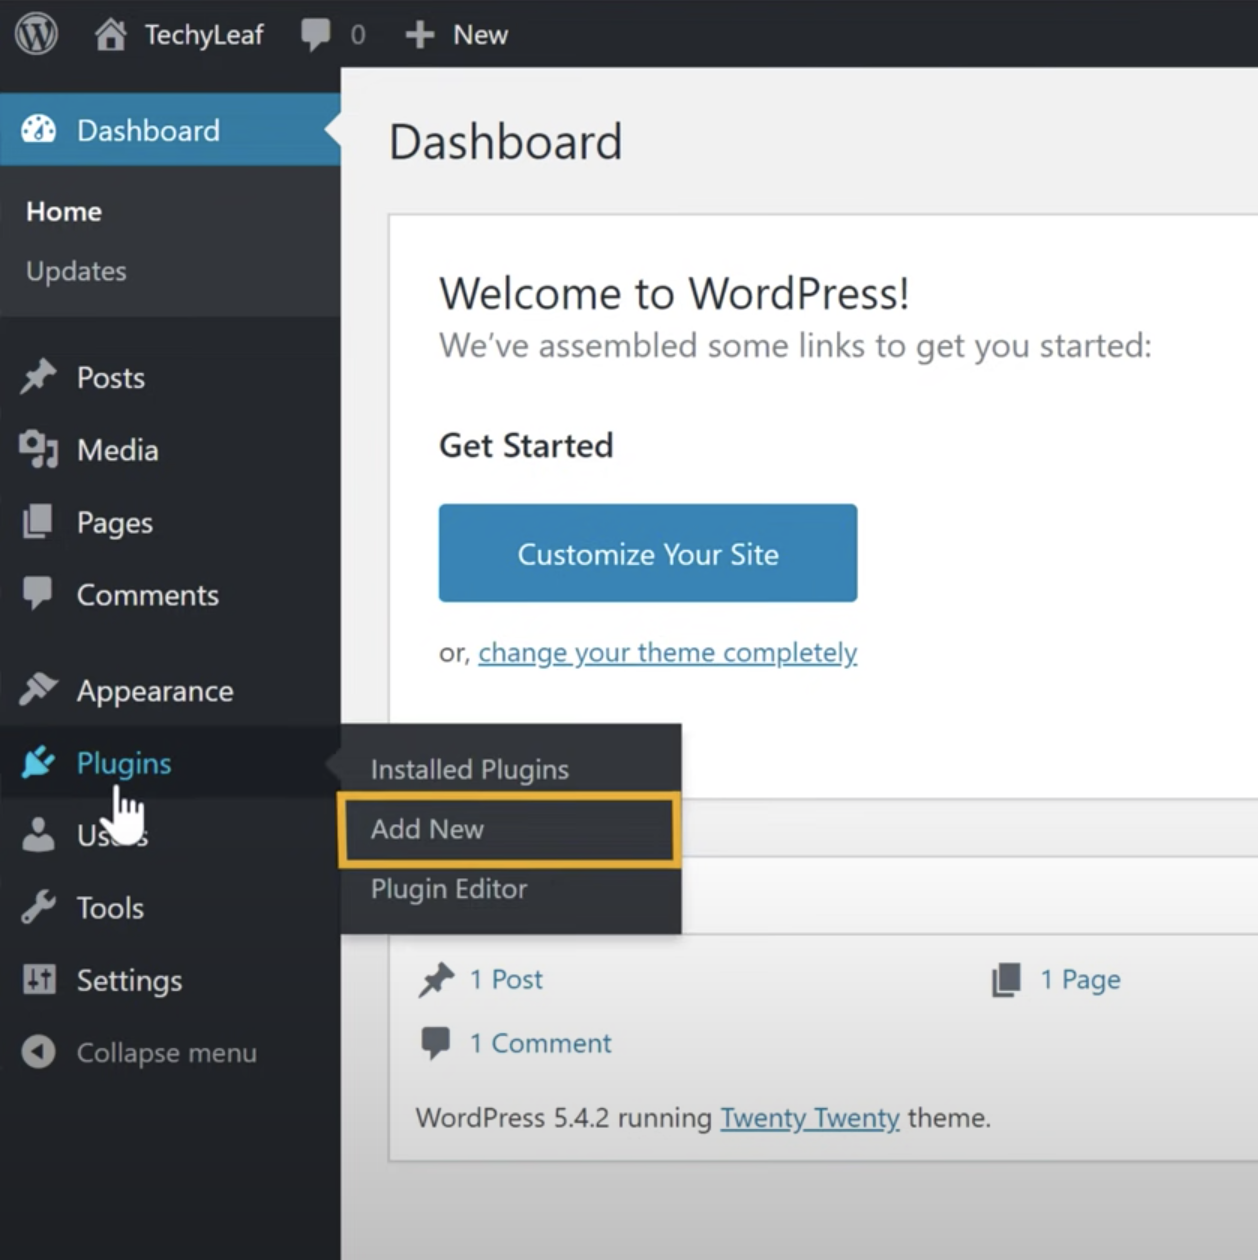
- Search ‘Site kit by google’ → install and activate it
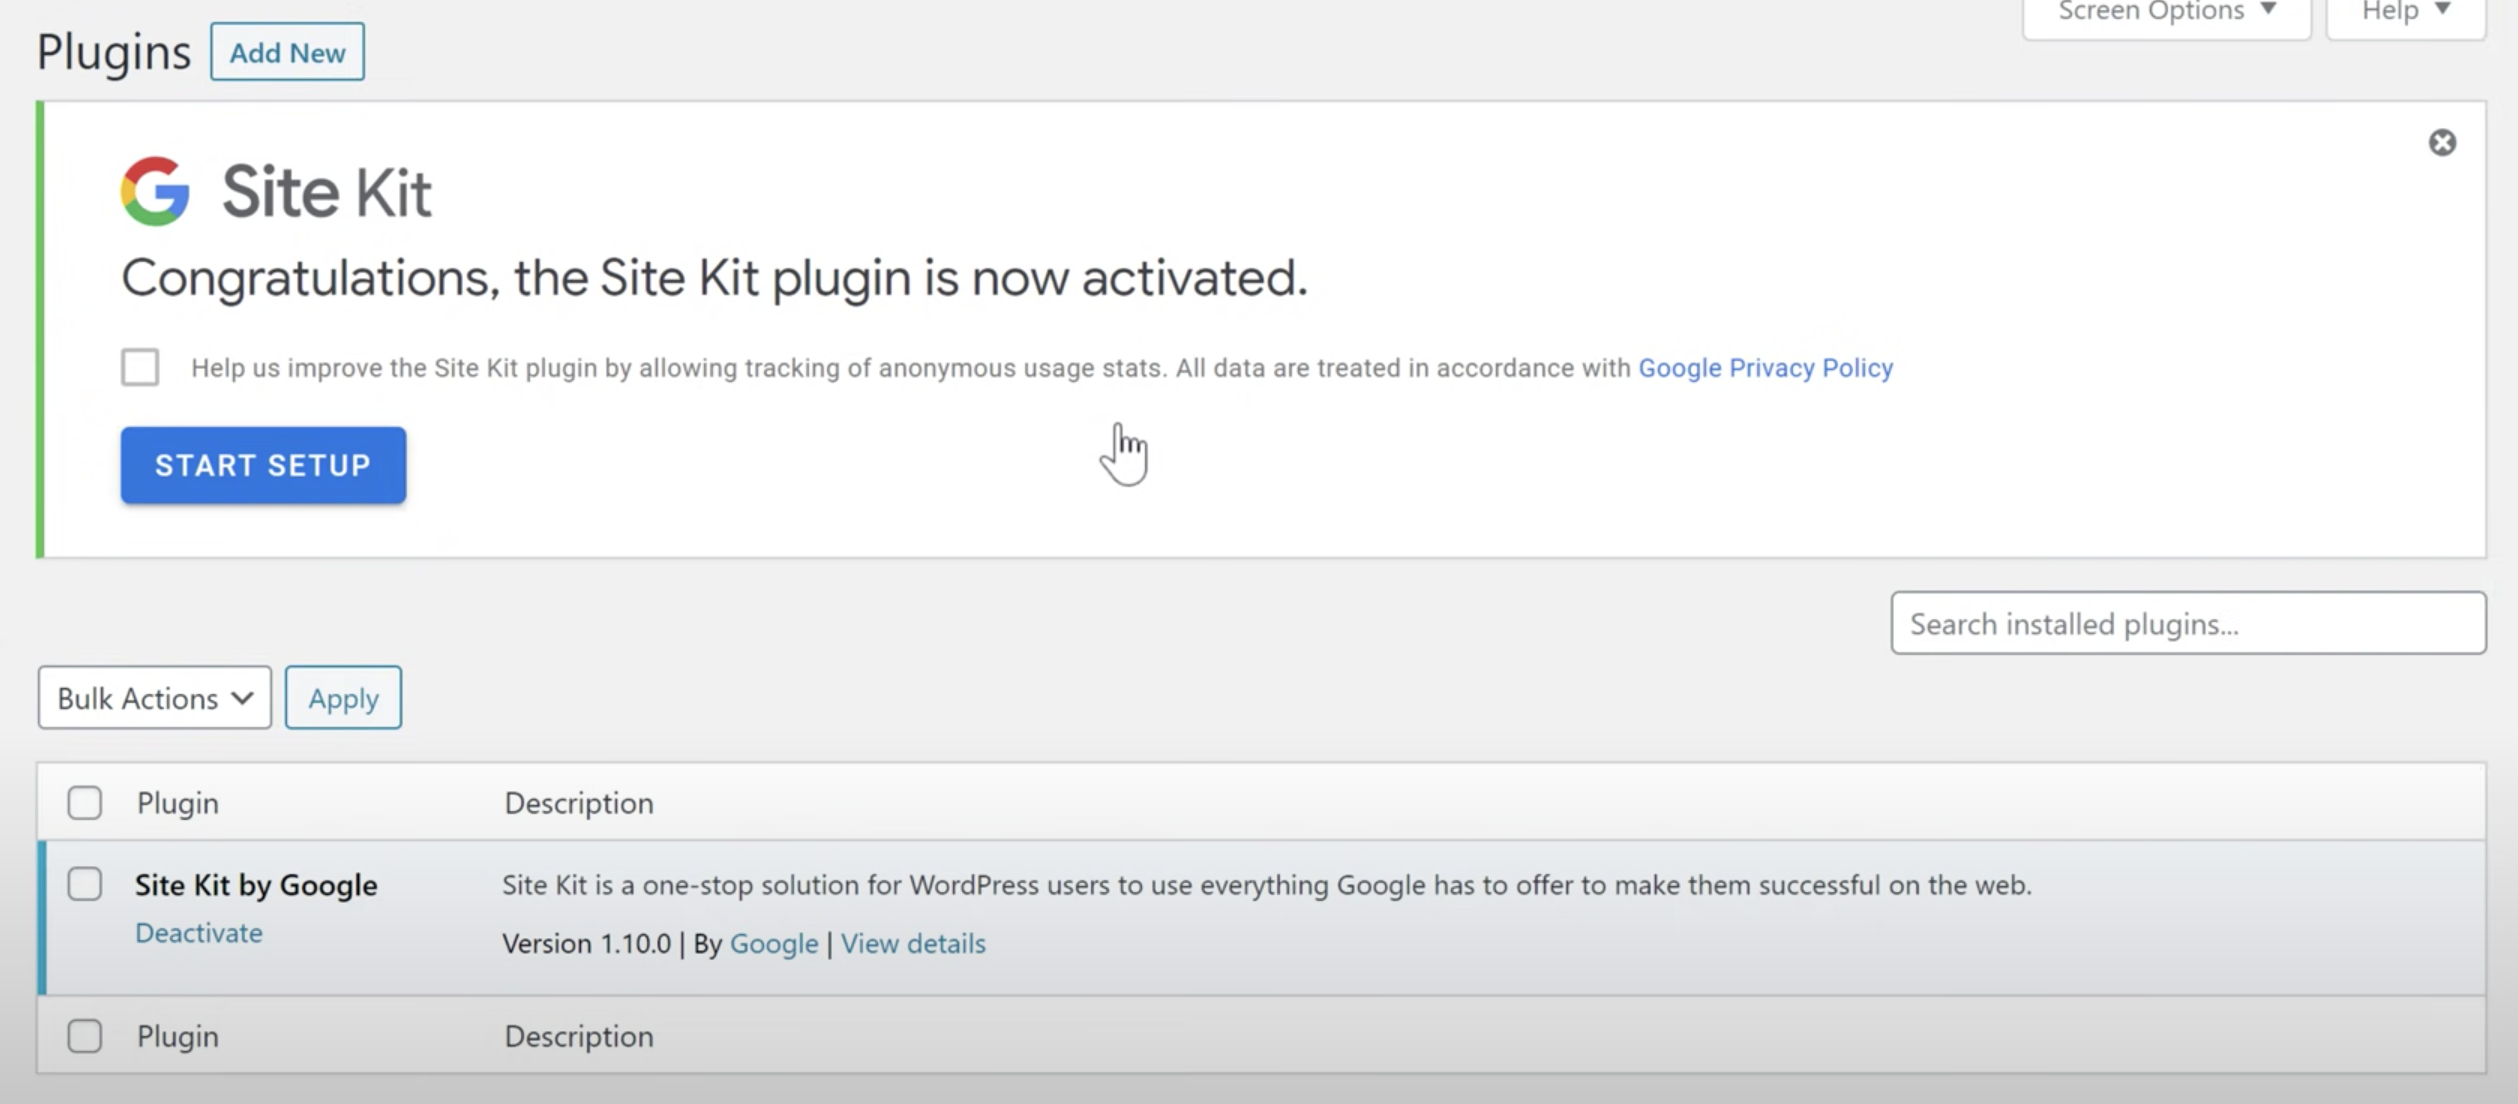
- Once you activate it, you will see a page like below → Press ‘Start Setup’
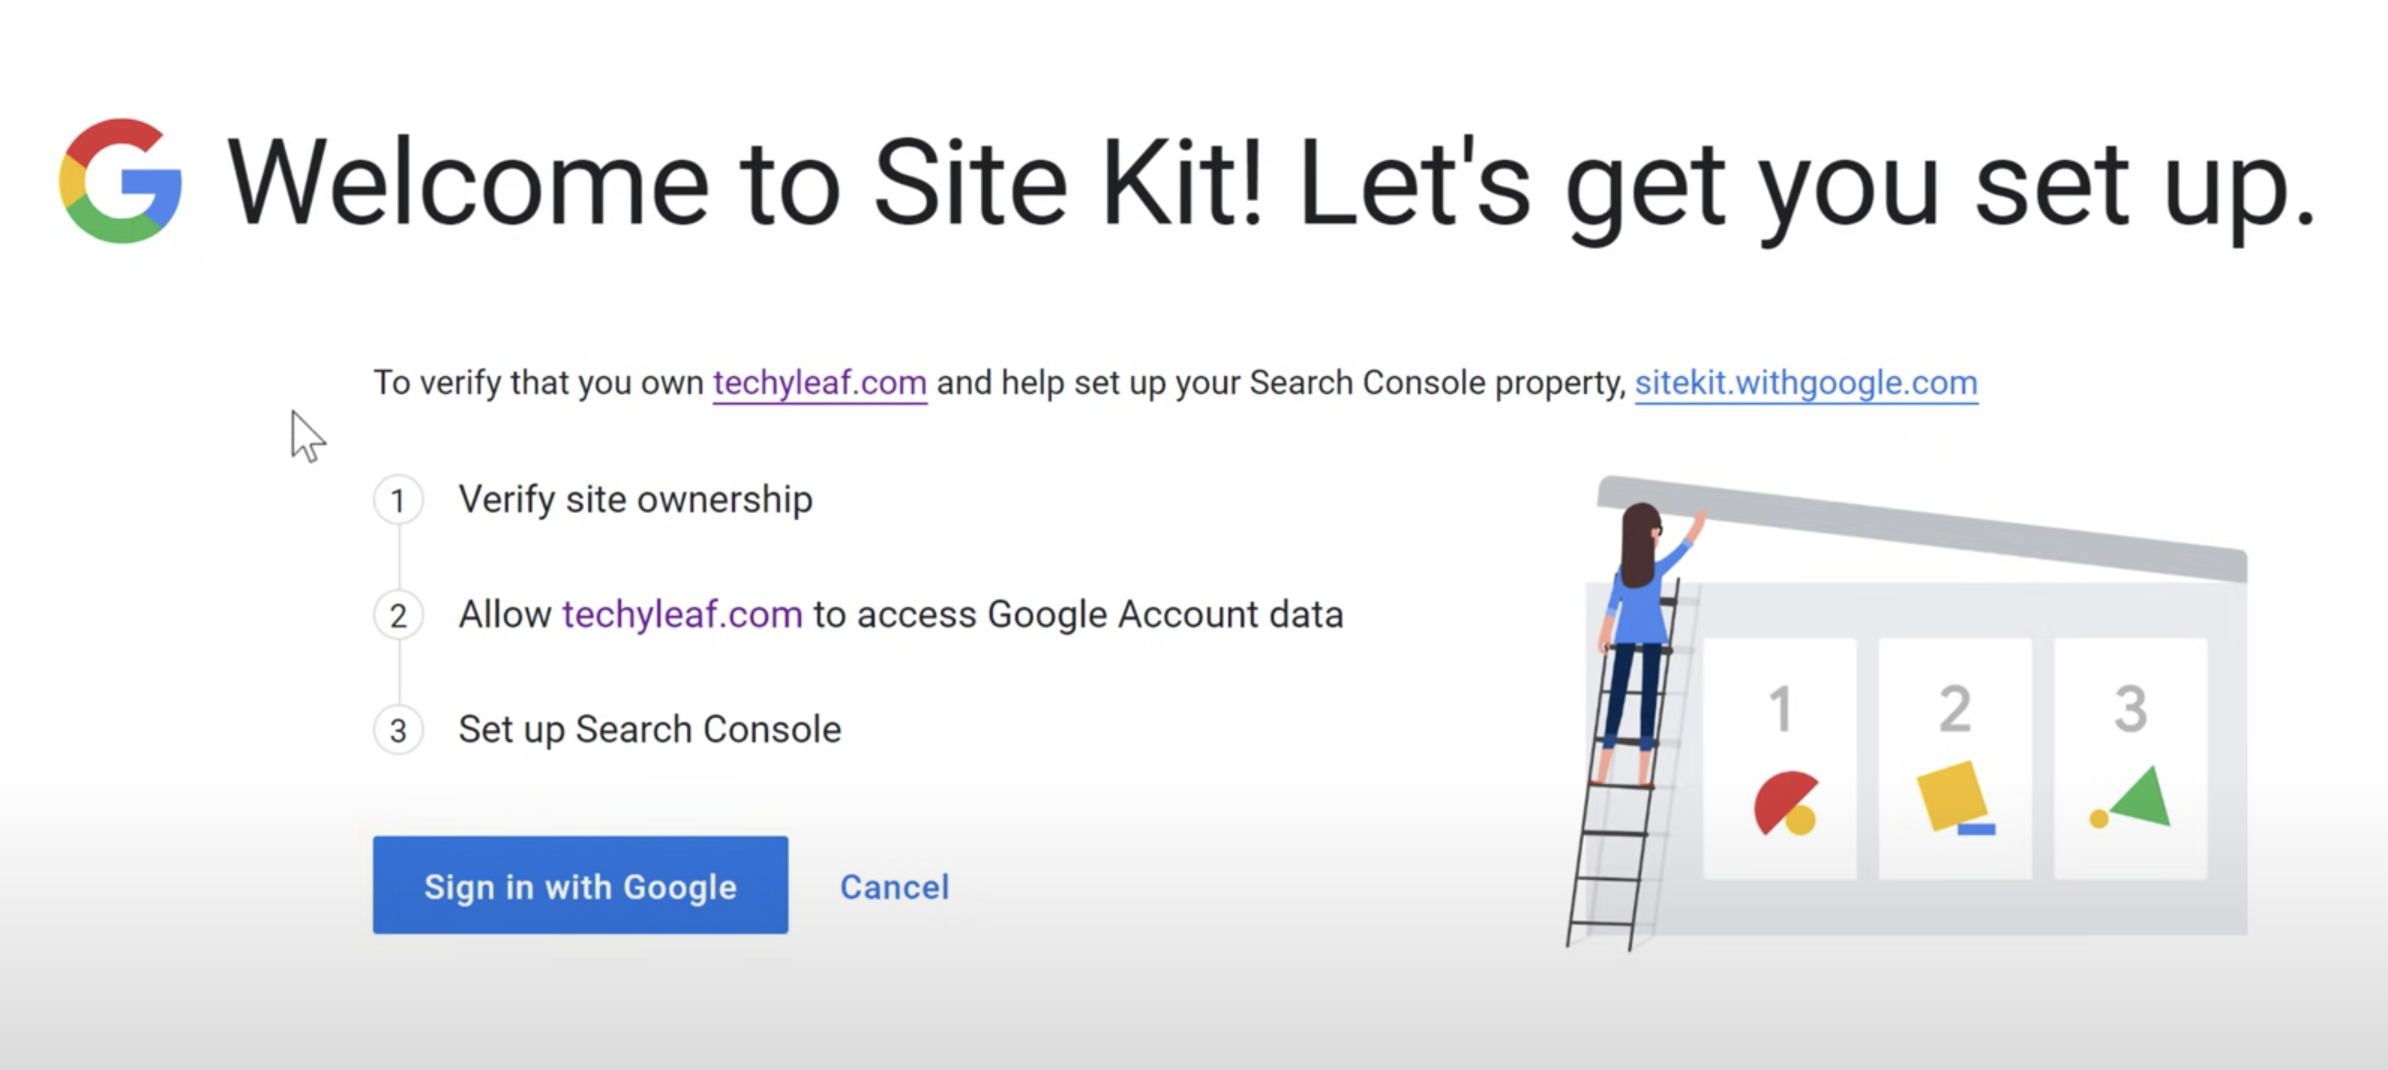
- Sign in to your Google account connected to GA4
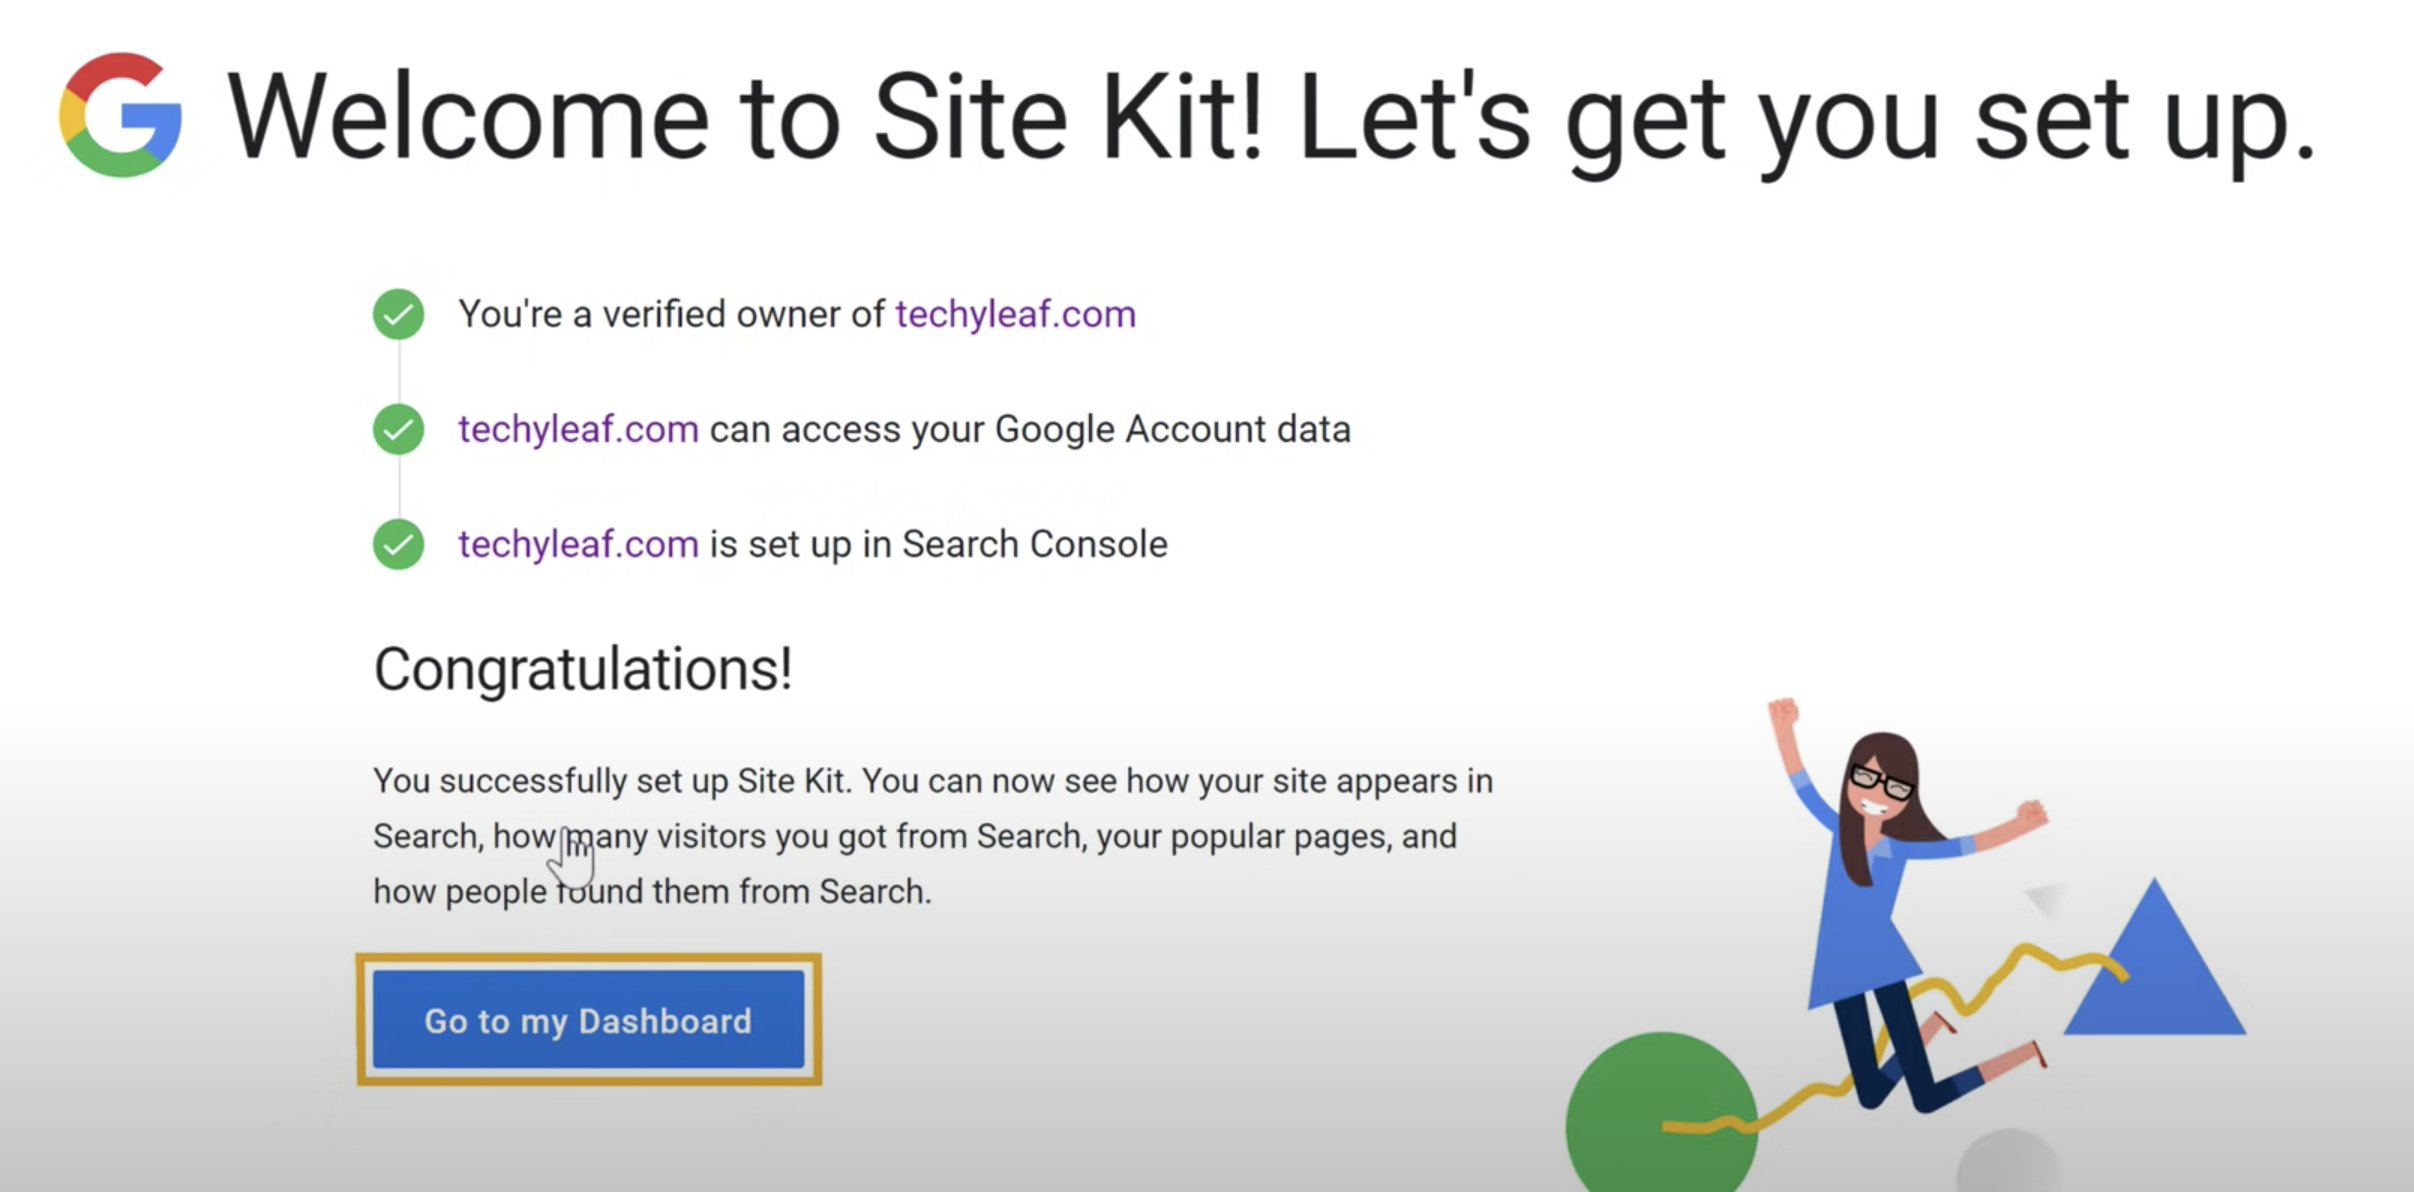
- Click ‘Go to my Dashboard’
- Click on ‘Analytics’
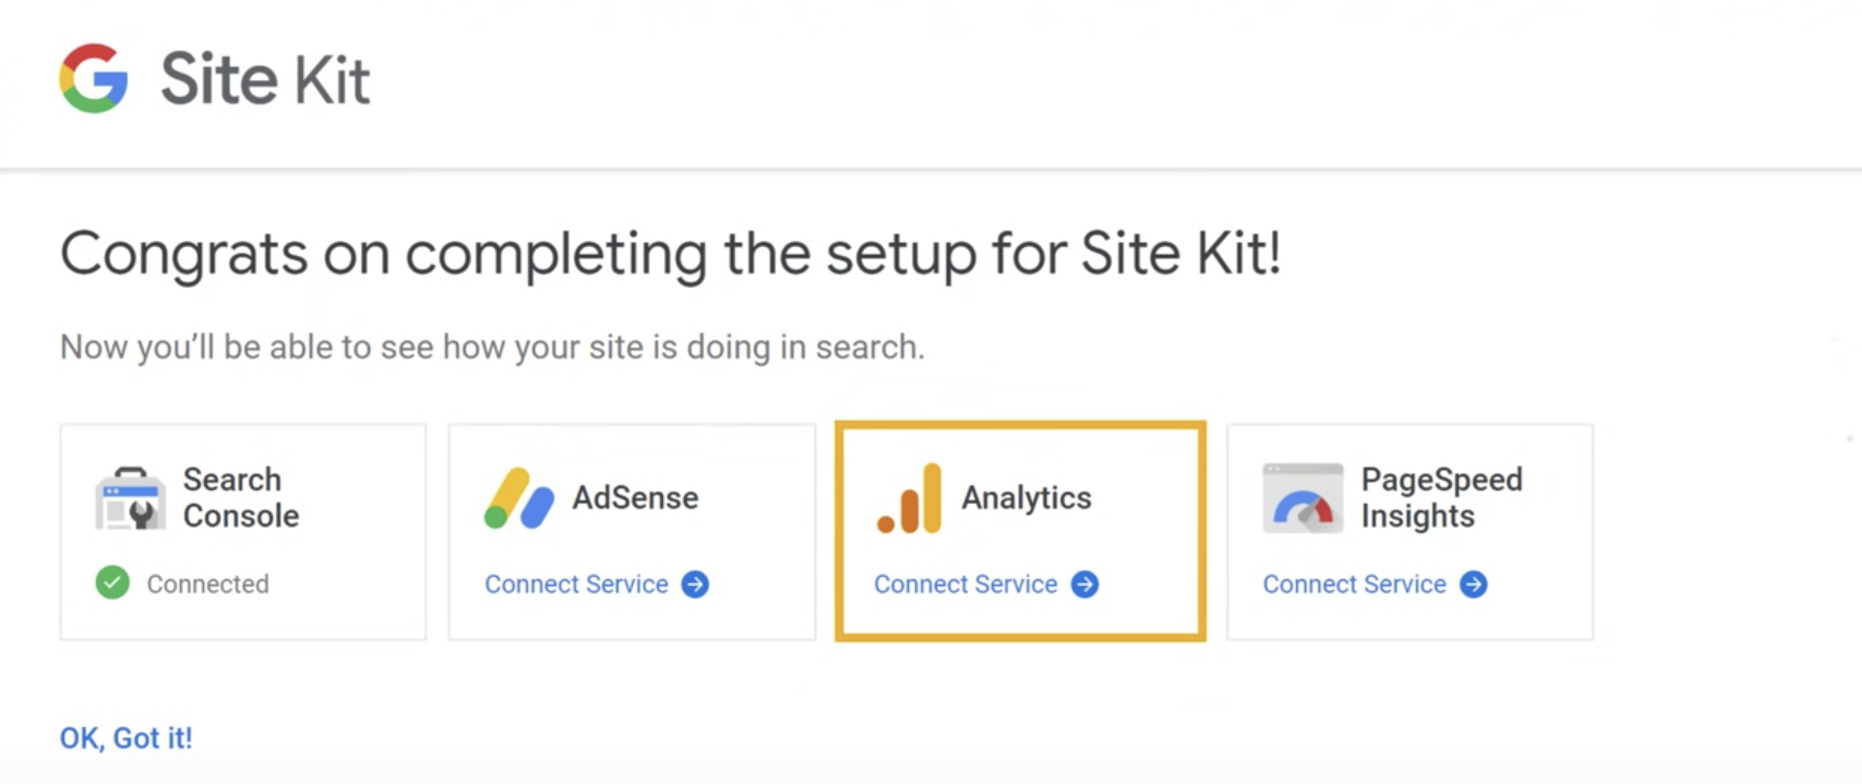
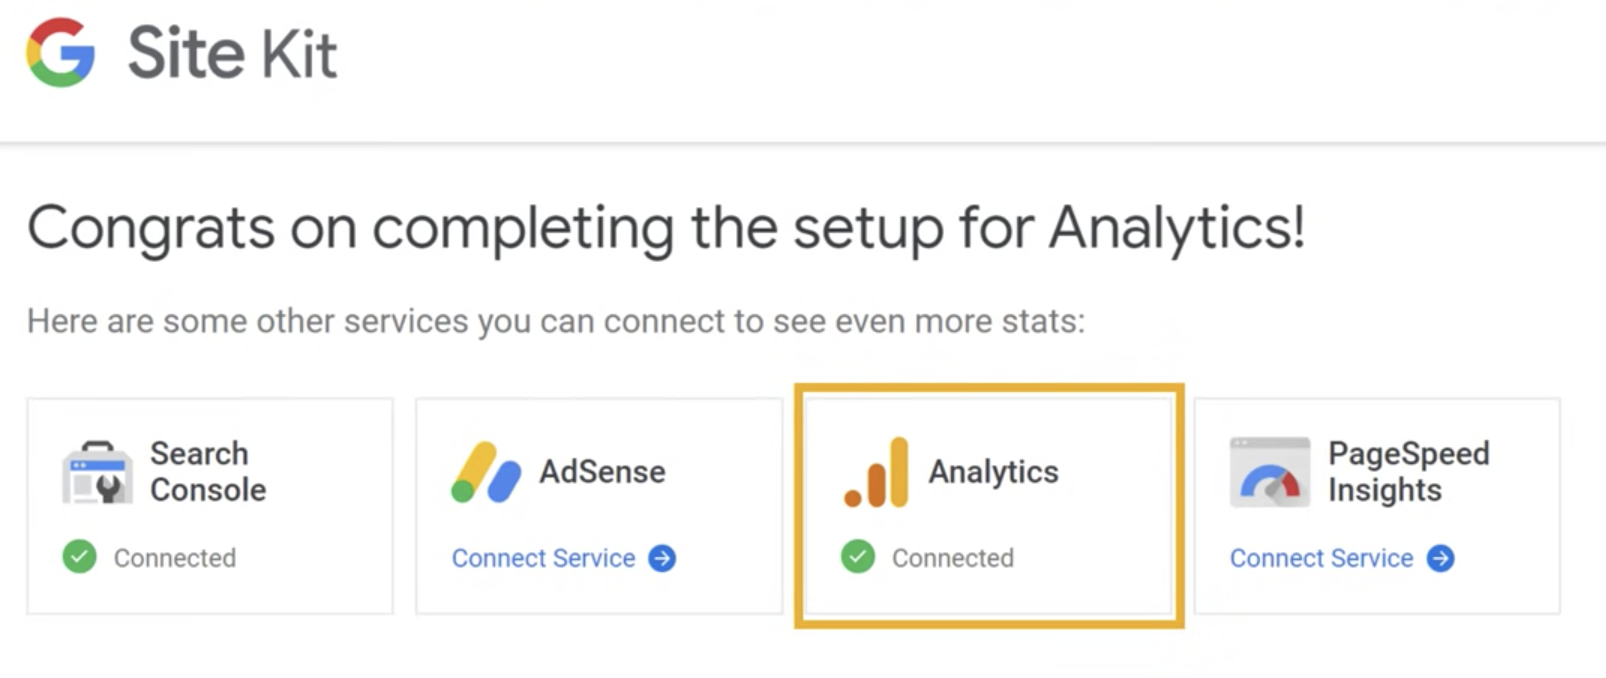
- Press ‘Configure Analytics’

- Completed! Now GA4 can track your website and you can see the web traffic data.
d) Share Access on Google Analytics with Other People
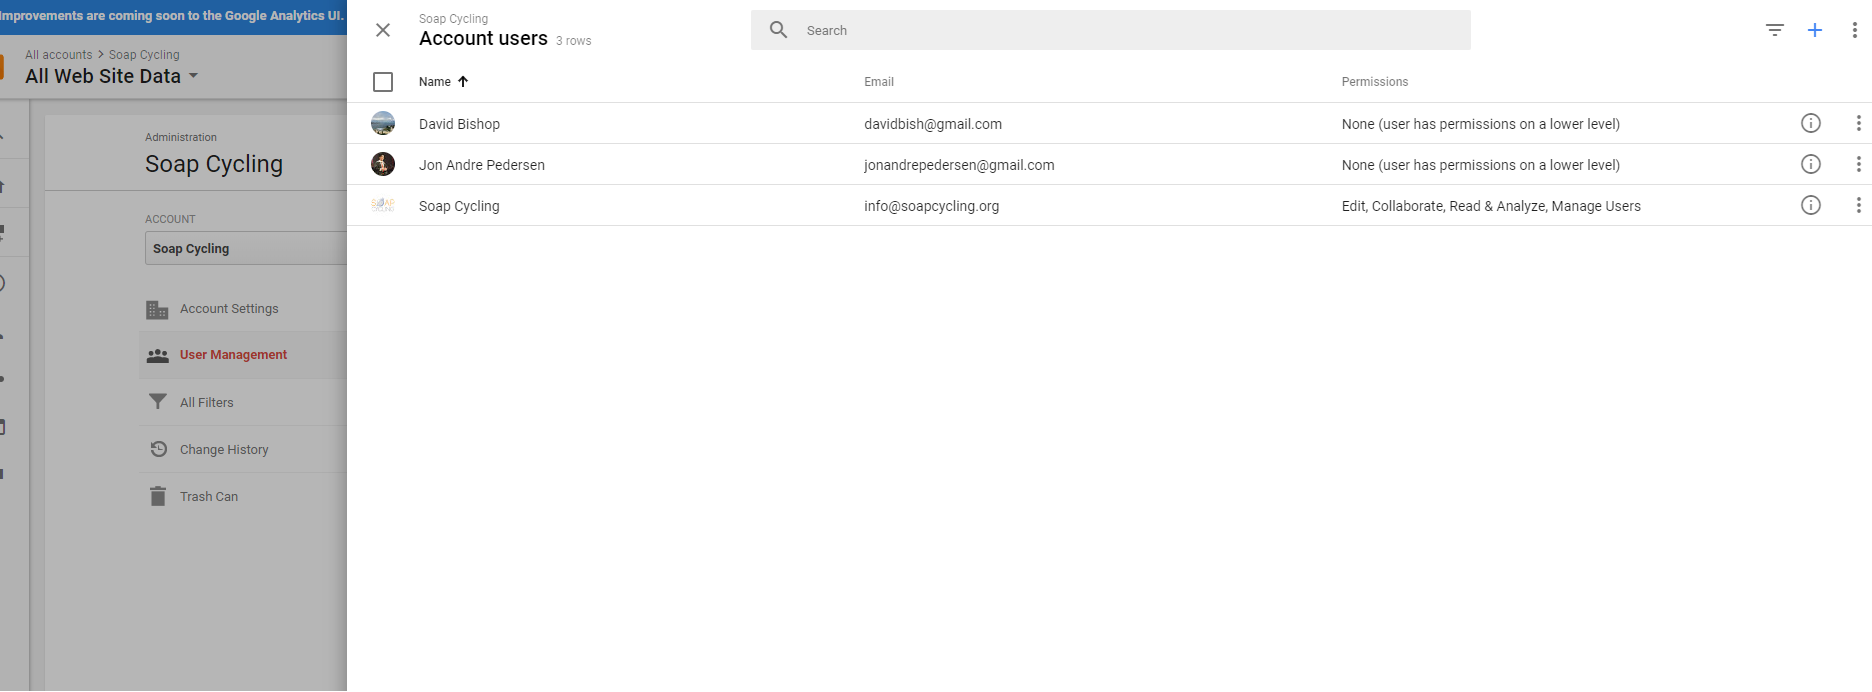
If you want to share GA access with your team members, interns, management, board members, or others, you do NOTneed to share give the full log-in access to your registered email. Instead, you can share access by inviting them to your GA workspace by following the steps below.
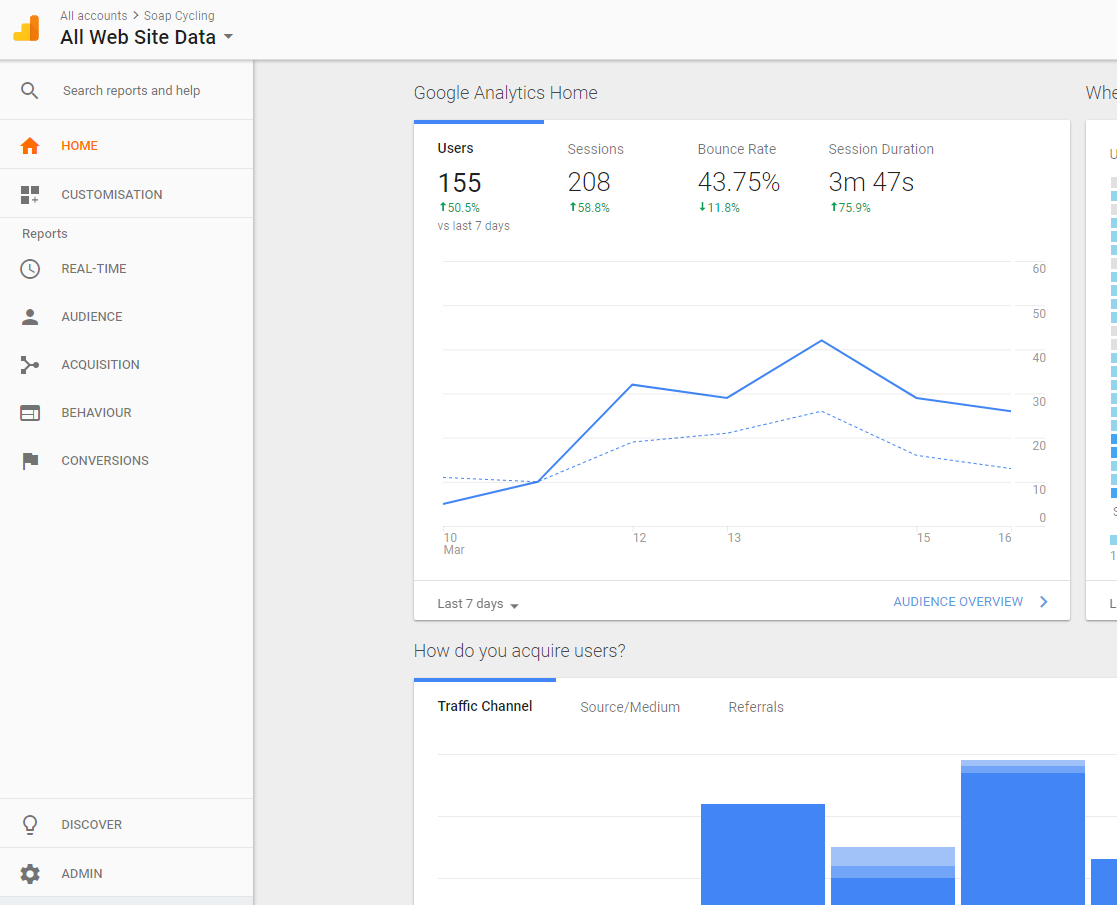
- Click on ‘Admin’
When logged in click on “Admin” in the bottom left.
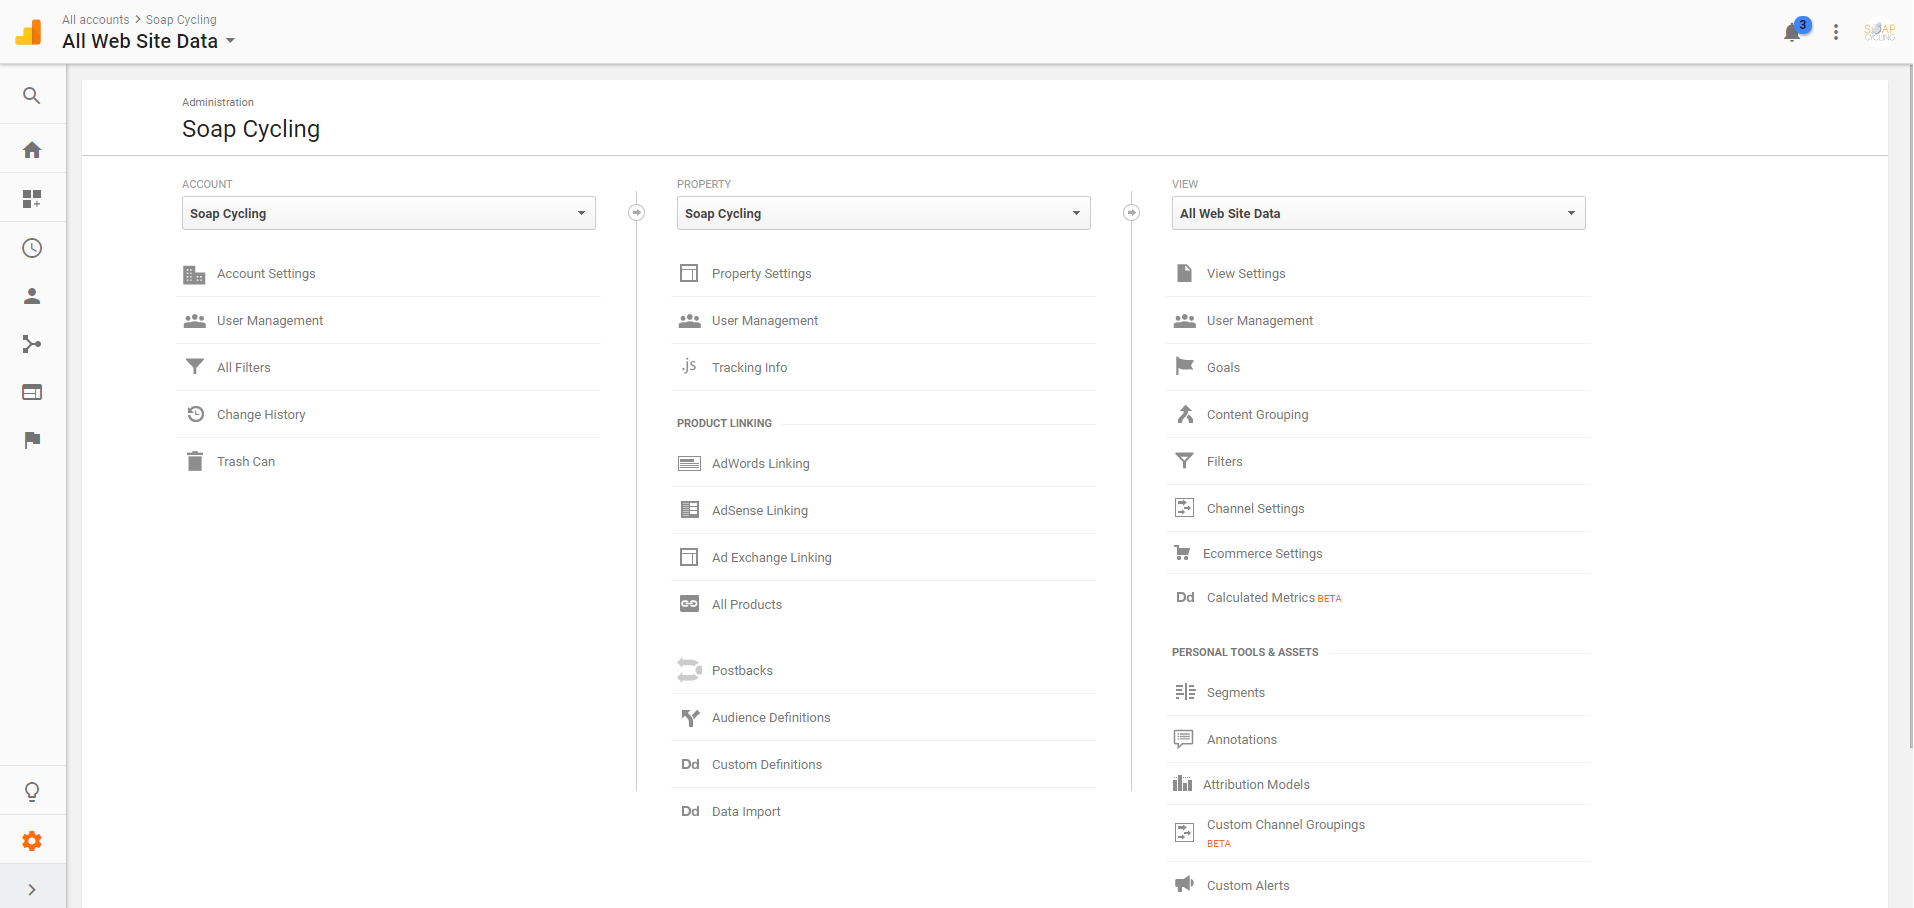
- Click on ‘User Management’
Click on “User Management” on the left column under “ACCOUNT”
- Click on the ‘+’ icon
Click the + icon on the top right
- Insert the email address you are inviting and the corresponding permissions
Write in the user(s)’ email address and choose the appropriate permissions. We should take great caution in enabling users to “Manage users”, so generally that should not be toggled on.
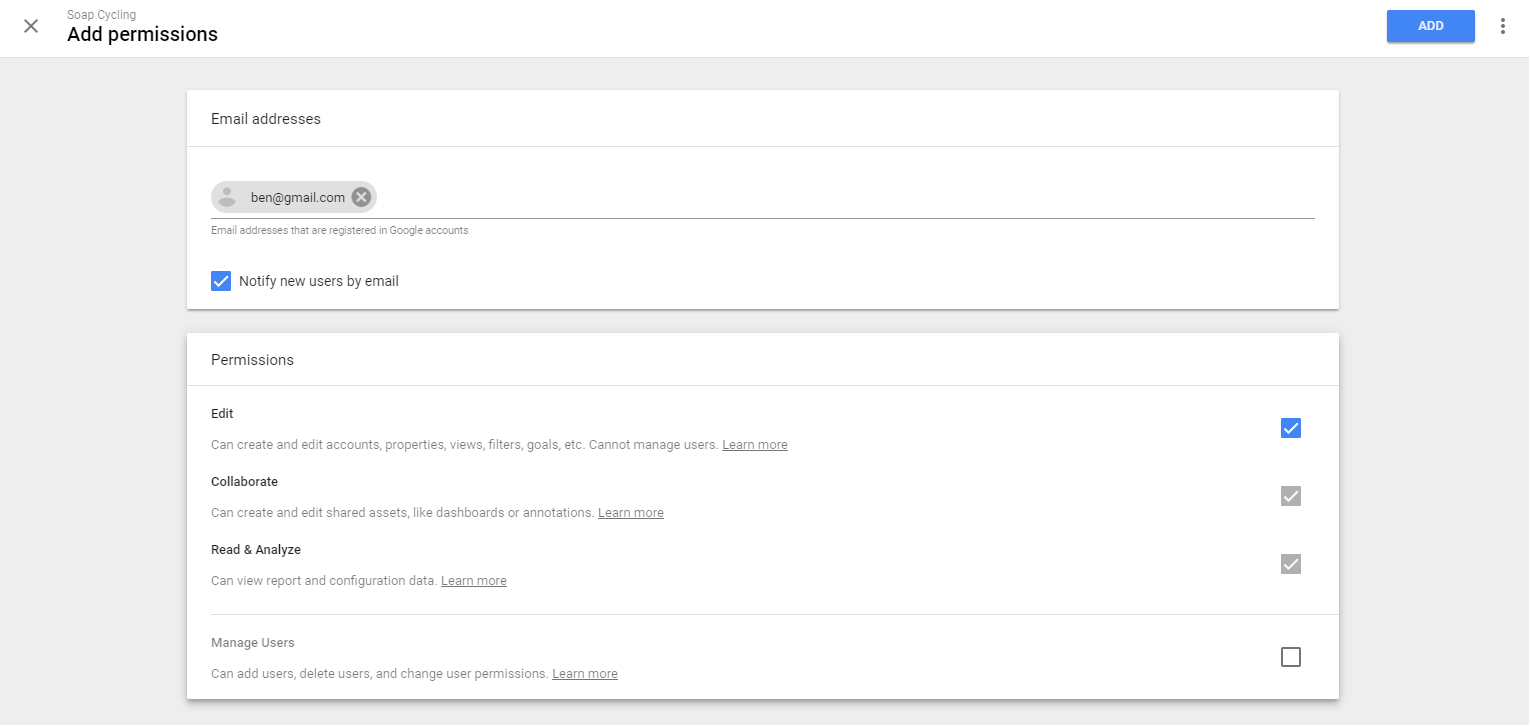
*The invited User can now log in to Google Analytics via their own email address and view the website data.
e) How to email yourself a recurring report
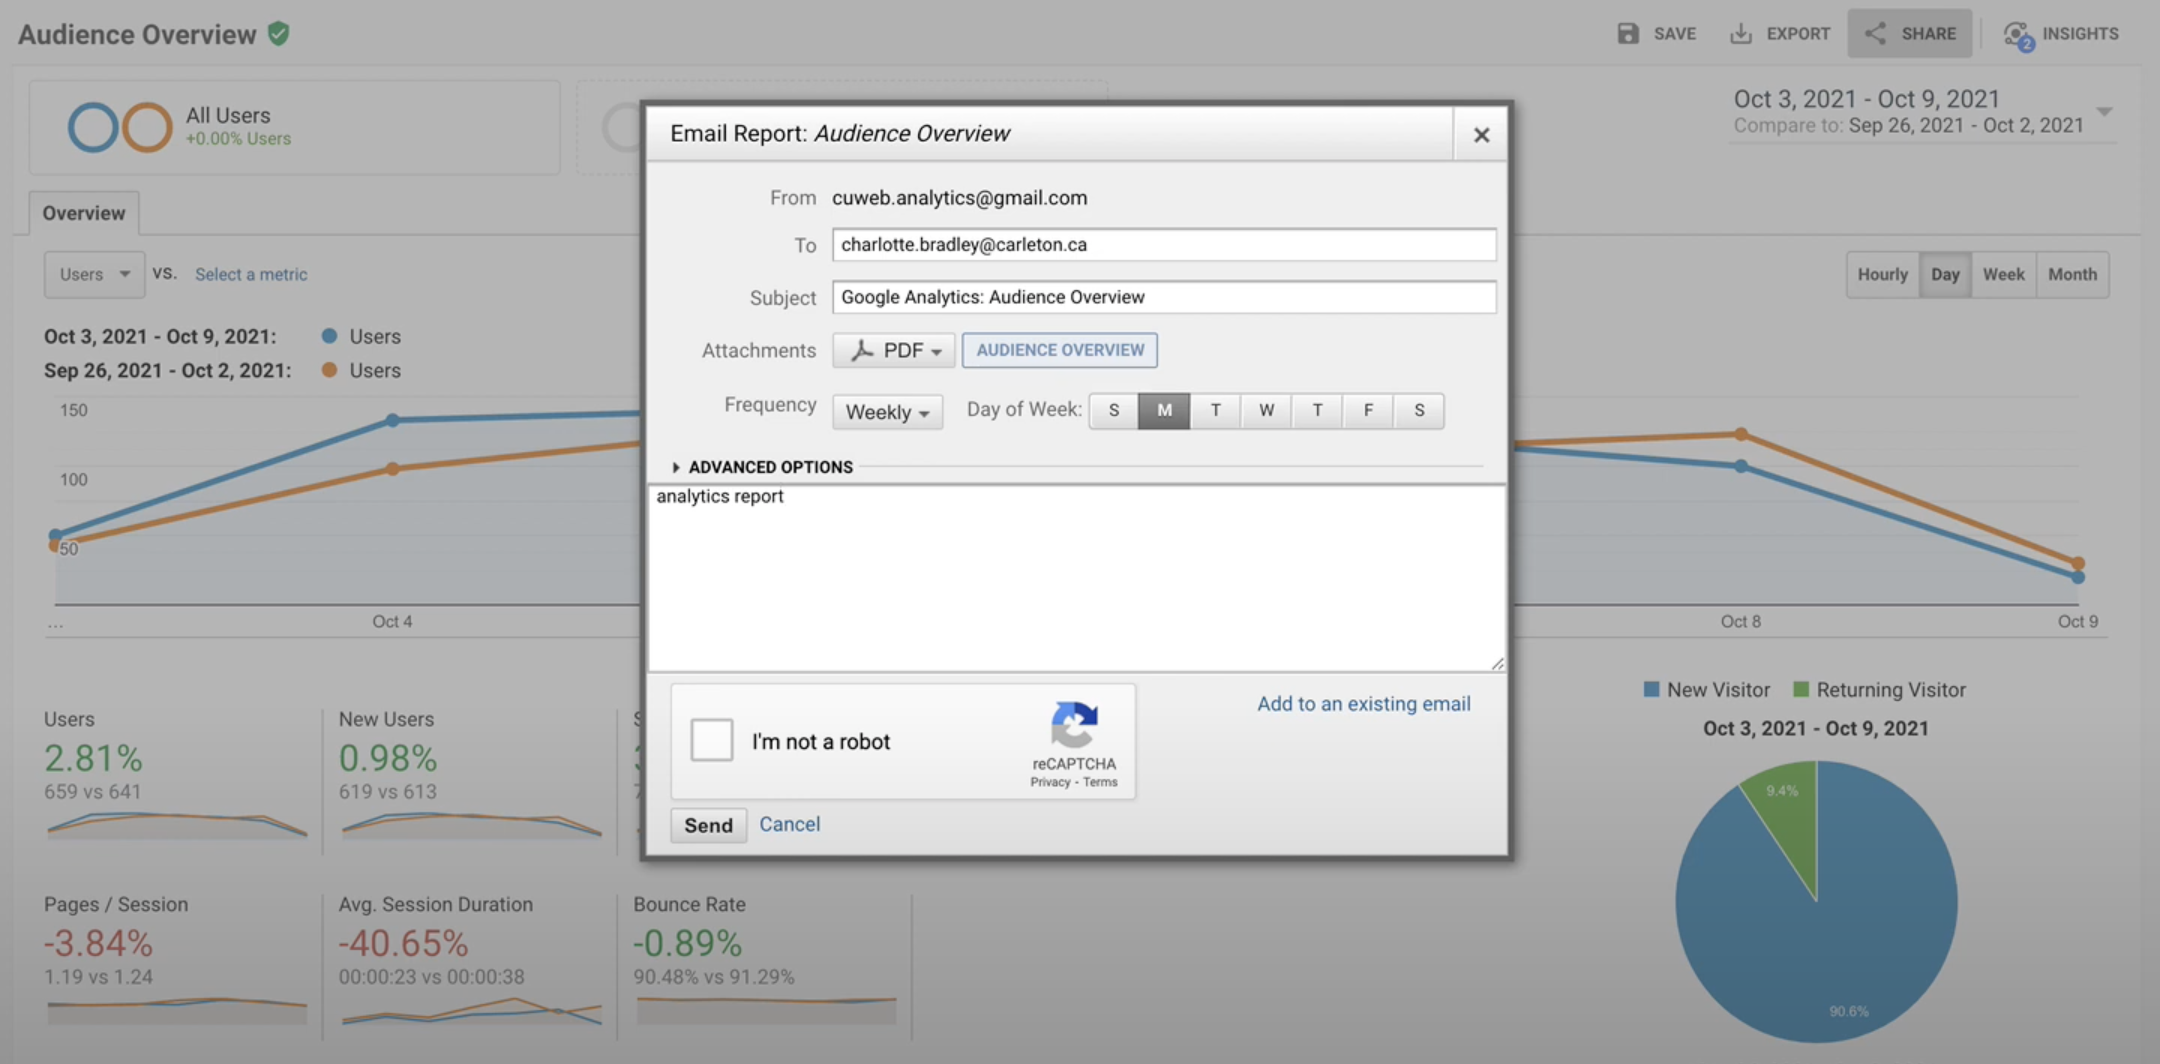
(1) Go on the report that you wanna receive regularly. (’Audience Overview’ in this example)
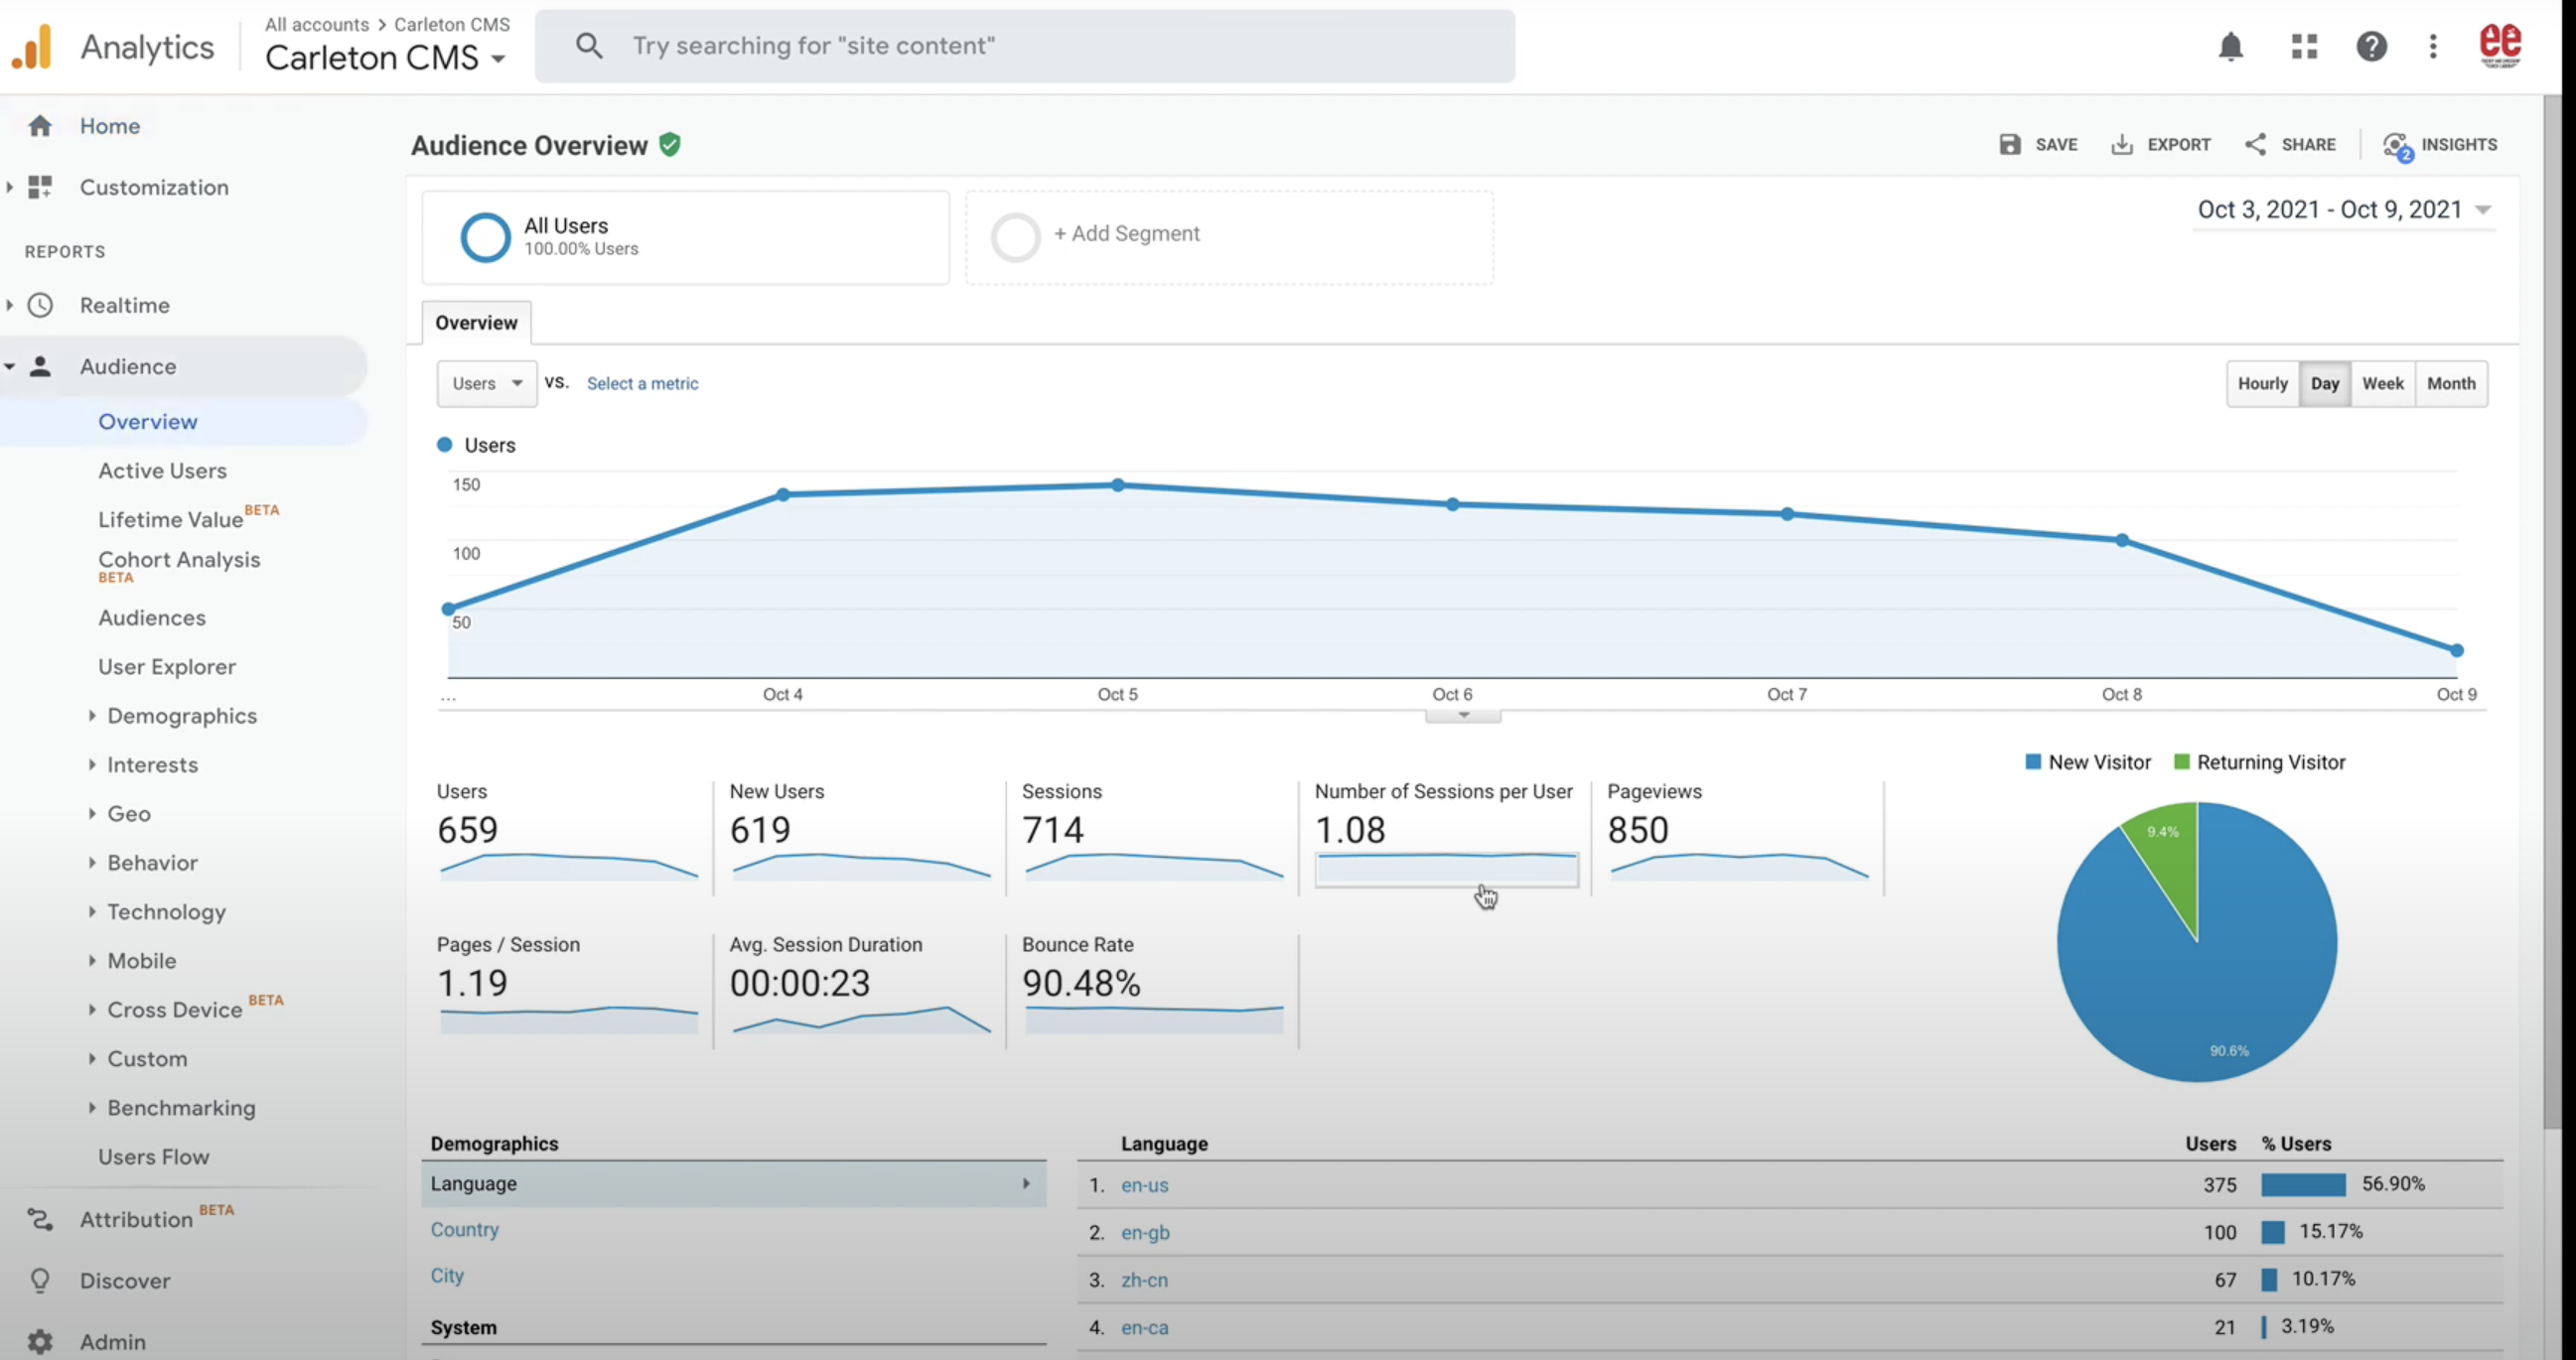
(2) Adjust the timeframe as the period you want to receive reports and set it as compare to previous period.
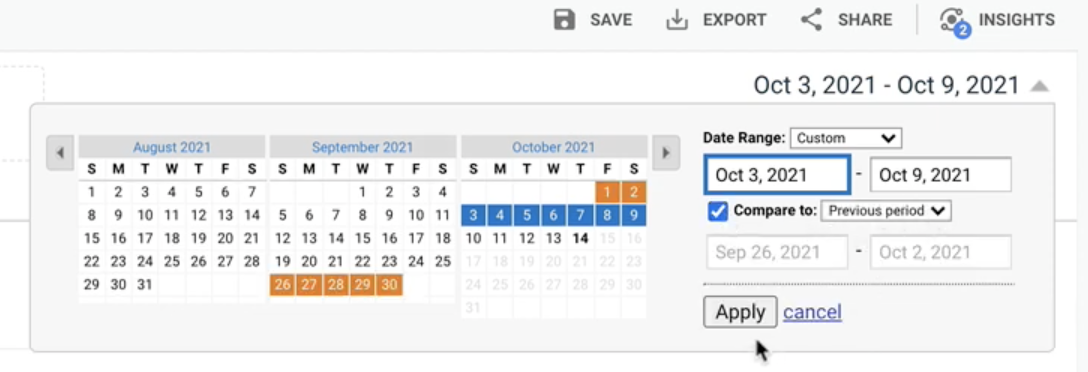
(3) Click ‘Share’ on the top right → insert your email → set the frequency
f) How to set up and manage view filters
You can exclude unwanted traffic and create custom views by creating and applying filters in GA4. For example, you can exclude internal traffic to show in your GA4 reports. However, edit permission is required in order to execute this action.
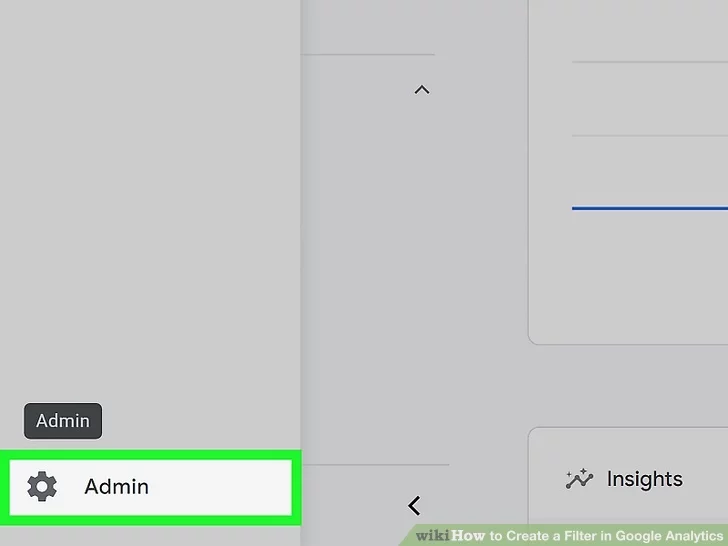
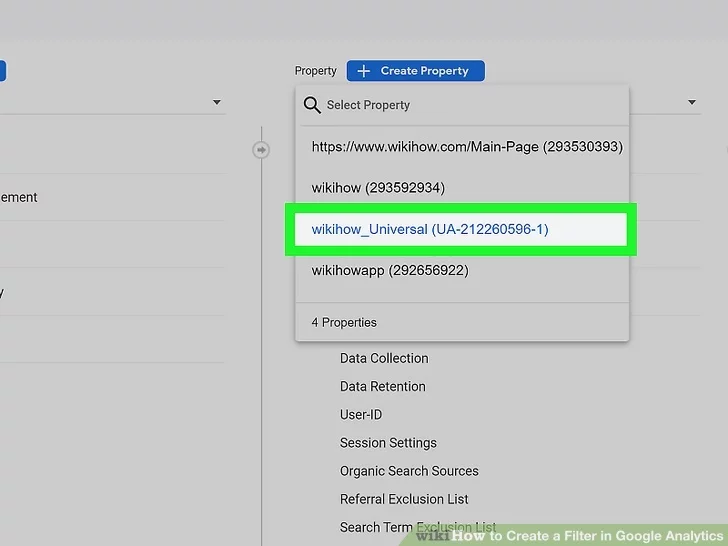
- Navigate to “Admin”. Then, select the property for which you want to create a filter for.
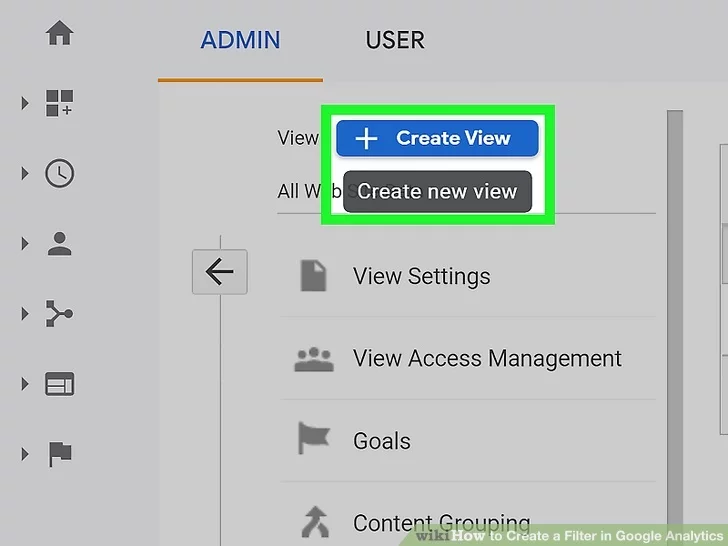
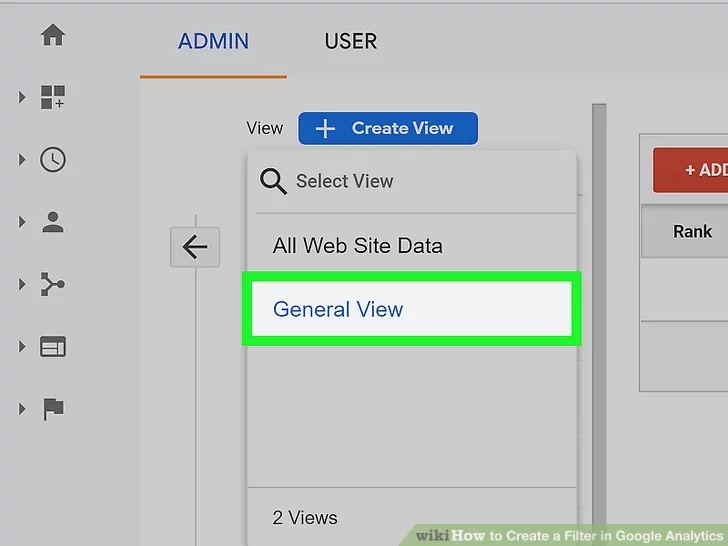
- Navigate to “Filters” in the “View” column (far-right) and create a view for your filter. Then, select the view you just created to apply the filter to.
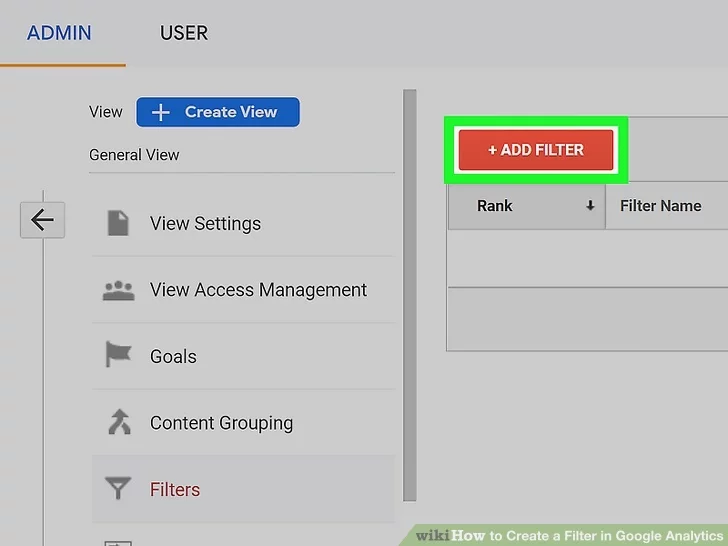
- Click the “+Add Filter” orange button in order to create a pre-defined or customized filter.
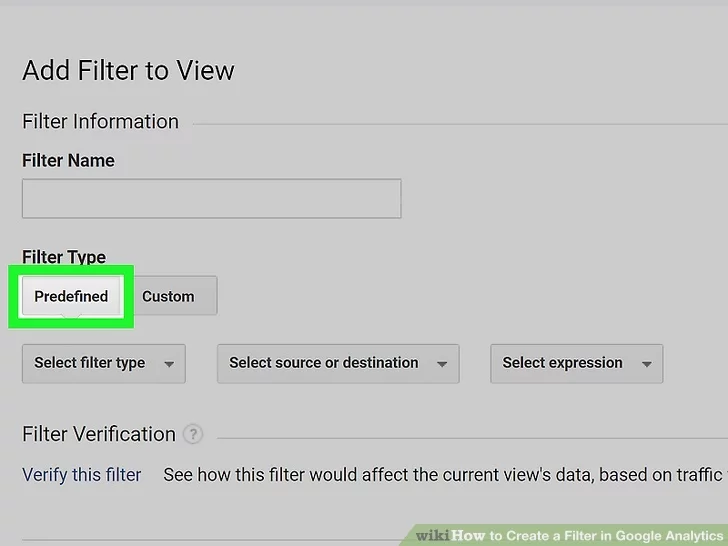
For more information on the different types of filters you can create, you can access: The 8 Most Important Google Analytics Filter, or watch these tutorial videos!
What you can monitor with Google Search Console vs. Google Analytics
In the world of digital marketing, Google Search Console (GSC) and Google Analytics (GA) are two instruments of massive influence with one shared objective: to increase website traffic. Both offer free services and are equally important to drastically enhance your website’s digital visibility to potential customers. GSC can monitor your website’s organic search position and identify webpages which lack optimization. On the other hand, GA delivers a broad range of metrics related to web traffic, such as engagement, demographic charts and the profitability of your Google Ads campaign. Below, we have summarized a list of the different features GSC and GA can help you monitor and display.


